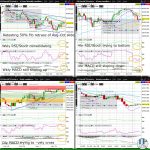
Nasdaq100 (NQ)’s Dead Cat Bounce (off the October low) is all but over as seen by the sharp reversal from the December high to near the 2022 low. NQ appears less likely to bounce back before year end to descending wedge resistance (on the weekly chart) than it is to break in the same period to a fresh 2022 low…