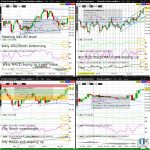
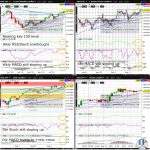
S&P500 (ES) Weekly Doji Tries Forming Just Below Key 4K Level

The S&P500 (ES) is consolidating after yesterday’s bounce, but remains wobbly going into next week with a weekly Doji trying to form just below the Oct-Feb uptrend support (on the weekly chart). Any weekly close below the psychologically key 4k whole figure level would reinforce the idea that the slightly higher February high versus the January and December highs was a bear trap…

S&P500 (ES) Testing Weekly Chart Downchannel Resistance

The S&P500 (ES) is consolidating after the strong reversal off the Wednesday Hammer low, hesitating as it bumps against downchannel resistance (on the weekly chart). Although odds are elevated for a weekly close above this key bear-bull battle ground, a break above the weekly chart downchannel resistance could very well be brief with the highly anticipated FOMC and Fed rate announcement Wednesday potentially setting up for a slide back into the same downchannel…

Nasdaq100 (NQ) Nearing Weekly Chart Descending Wedge Resistance

Nasdaq100 (NQ) is consolidating after the strong short covering last week, taking a breather before it attempts an extension to descending wedge resistance (on the weekly chart) going into February. NQ does not appear likely to slide back to the 2022 low before month end, with any test of the psychologically key 10k whole figure level and weekly chart descending wedge support likely deferring until at least mid February…

Nasdaq100 (NQ) Tries Bouncing To Weekly Chart Descending Wedge Resistance

Nasdaq100 (NQ) is consolidating after the strong short covering this week, taking a breather before it attempts an extension to descending wedge resistance (on the weekly chart) going into February. NQ does not appear likely to slide back to the 2022 low before month end, with any test of the psychologically key 10k whole figure level and weekly chart descending wedge support likely deferring until at least mid February…

Nasdaq100 (NQ) Tries Forming Another Dead Cat Bounce

Wheat (ZW) is starting the week consolidating for a 3rd straight day near the 2022 low, remaining vulnerable to a deeper slide towards descending wedge support (on the weekly chart) in January. With ZW below the 61.8% Fib retrace of the September 2016 to March 2022 bull market (as can be seen on a monthly chart on tradingview.com), ZW is moderately vulnerable to sliding back to the 2021 low just below the psychologically key 600 whole figure level sometime in Q1…