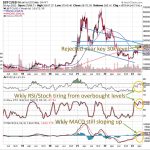
TOP50’sTOP10 (BTCUSD, ETHUSD, LTCUSD, BNBUSD, AVAXUSD, EOSUSD, MATICUSD, ATOMUSD, DOTUSD, XTZUSD)
TOP50’sTOP10 (BTCUSD, ETHUSD, LTCUSD, BNBUSD, AVAXUSD, EOSUSD, MATICUSD, ATOMUSD, DOTUSD, XTZUSD)
Nasdaq100 (NQ) is consolidating after surging more than 2.5% yesterday, and is trying to complete its 4th straight weekly Hammer or Doji. NQ is arguably back in the advanced stages of a Bull Flag near the 2023 high (formed in April), where it appears to be gearing up to retest in May, the weekly chart ascending wedge resistance and the 50% Fib retrace of the bear market from the November 2021 high (as can be seen more easily on a weekly chart on tradingview.com)…
Arabica Coffee (KC) slid more than 1.5% yesterday, closing below triangle support (on the 4hr chart). KC appears to want to further consolidate next week following last week’s high….
The USDCAD is consolidating after the strong gains of the past 2 weeks, but appears to have upside momentum to gravitate to triangle resistance (on the weekly chart) by early May sometime. With the USDCAD comfortably back above the psychologically key 1.35 whole figure level, the USDCAD is arguably in the advanced stages of the weekly chart triangle which is arguably a Bull Flag consolidation (as can be seen easier on a monthly chart on tradingview.com)…
Arabica Coffee (KC) rebounded more than 1.5% yesterday, and appears to be in the advanced stages of its consolidation following last week’s high. Although KC closed yesterday below upchannel support (on the daily chart), it remains near the February high…
Register/Login to freely access technical analysis on the market described in the headline above. Today’s Top 3 Trades includes technical analysis on: Metals/Energy (Gold | Natural Gas) + Today’s Top Trade (VIX) Join the world’s largest asset manager and 3 of the world’s 5 largest (and 5 of the 10 largest) hedge funds by AUMRead More
Arabica Coffee (KC) slid more than 2.5% yesterday, breaking below upchannel support (on the 4hr and daily chart) and closing near the February high. With the current weekly Gravestone failing to reclaim the psychologically key 2 whole figure level, odds are increasing for a further swing from Wednesday’s fresh 2023 high to upchannel support (on the weekly chart) by early May…
Nasdaq100 (NQ) is struggling to extend a Bull Flag near the 2023 high (formed in April). With NQ just above the 38.2% Fib retrace of the bear market from the November 2021 high (as can be seen more easily on a weekly chart on tradingview.com), NQ is appearing increasingly unlikely to muster enough upward momentum in its rally off the October low to make a final push by May sometime to upchannel resistance (on the weekly chart)…
Arabica Coffee (KC) edged up 1% plus yesterday, firming near the February high. Any decisive bounce off upchannel support (on the 4hr and daily chart) in the next day or so would likely coincide with a retest of the psychologically key 2 whole figure level…
Corn (ZC) appears vulnerable to more healthy profit taking to start the week after failing last week to close above symmetrical triangle resistance (on the weekly chart) following Tuesday’s surge above it. A break below upchannel support (on the daily chart) seems likely in the next day or so, with moderate odds for a retest of the April low before month end…