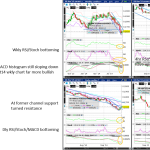
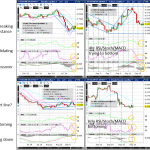
Corn (CME ZC Dec14) Weekly/Daily/4hr/Hourly ZC began clawing back recent losses yesterday, looking increasingly attractive given its extremely low weekly Slow Stochastics %K/%D values of 1.24 and 2.12 (obtained at the time of this writing from stockcharts.com’s 5yr weekly chart with Slow Stochastics of the $CORN symbol). It is also sitting under descending wedge supportRead More
Month: September 2014
VIX Making Higher Highs, Higher Lows
Raw Sugar (ICE SB Mar15) Weekly/Daily/4hr/Hourly SB had a strong performance last week and is now back into the downchannel that it had broken below a few weeks ago (as seen in the daily chart). After the incredible rally last week, the weekly RSI and Slow Stochastics are turning up nicely, with the weekly MACDRead More
Commodities Putting in a Short-Term Bottom
Raw Sugar (ICE SB Mar15) Weekly/Daily/4hr/Hourly SB has just completed a double bottom with its 2010 low at .13 (on the spot price chart posted yesterday). The double bottom has coincided with an increasingly narrowing descending wedge’s support line. The weekly RSI, MACD and Slow Stochastics are all turning up now. As mentioned yesterday, theRead More
Raw Sugar (SB) Confirms Double Bottom at Descending Wedge Support
Raw Sugar – Spot Price (EOD) ICE Weekly SB has just completed a double bottom with its 2010 low at .13 (on the spot price chart below). Also key is the strong bounce off of support at an increasingly narrowing descending wedge. The March15 contract has lagged behind the October14 contract in this week’s rallyRead More
Natural Gas Weekly/Daily/4hr/Hourly Charts Aligning Bullishly
Natural Gas (CME NG Nov14) Weekly/Daily/4hr/Hourly For the first time since I’ve added NG to my watchlist, its weekly, daily, 4hr and hourly charts are all pointing bullishly. NG is now sitting near channel support (as seen in the daily chart) ahead of tomorrow’s inventory figures, after having successfully tested this zone of 3.75-3.9 fourRead More
Netflix (NFLX), Tesla (TSLA) Resume New Downtrend
VIX (CFE VX Oct14) Weekly/Daily/4hr/Hourly Following yesterday’s rally, the VIX is now nearing resistance seen last week around the 15.3 level (refer to the daily and 4hr chart). Although the daily RSI and Stochastics might appear tiring, the rising daily MACD along with rising weekly RSI, Stochastics and MACD all suggest the next resistance levelRead More
VIX Forming Quadruple Bottom
Going forward, due to the time it takes to analyse the markets I profile daily, I’ll be including brief paragraph comments accompanying only what I feel are the top 3 most important sets of charts to view for the day, ordered as usual from top to bottom by importance (due to newly developing technical patternsRead More
EURCHF Added to Watchlist
EURCHF Weekly/Daily/4hr/Hourly EURCHF didn’t see the SNB intervention yesterday that market watchers have been widely expecting. I continue to anticipate the intervention around the 1.2 level, and will hold my current long at 1.208 for now. Note the risk of the EURCHF falling towards the bottom of the downchannel as seen in the weekly chartRead More
Arabica Coffee (KC) Resuming Rally as US Dollar Peaking Near-Term
Arabica Coffee (ICE KC Dec14) Weekly/Daily/4hr/Hourly/30min/5min After yesterday’s late session rally, KC sits increasingly well positioned for a resumption of its uptrend. Crucially, the weekly and daily RSI, Stochastics and MACD are all trying to bottom, with the exception of the weekly MACD which still slopes down slightly. I’ll continue watching for a near-term peakingRead More
FOMC Today, Scottish Referendum/LTRO Tomorrow
Cotton (ICE CT Dec14) Weekly/Daily/4hr/Hourly/30min/5min CT has now retraced almost half of the rally from its July low to its peak last week. It is showing bottoming action in the 4hr and hourly chart, and is fairly near the rising support line shown in the daily chart. CT also remains above longer term downchannel resistanceRead More