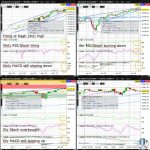
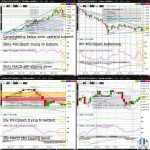
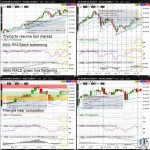
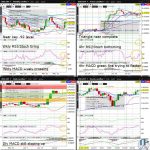
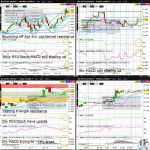
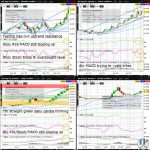
Natural Gas (NG) is trying to form its 7th straight green daily candle after forming a fresh 2021 high yesterday. Significantly, NG is vulnerable to a healthy correction as it bumps up against the upchannel resistance (on the weekly chart) connecting the December to June highs, and hinted at the loooming pullback with yesterday’s strong intraday reversal…
Month: June 2021
S&P500 (ES) Hesitates Near Record High Going into 2nd Half, NFP
The S&P500 (ES) is seeing a bit of healthy profittaking after yesterday’s fresh record high, and sits vulnerable to a deeper selloff following the end of 2021’s first half Wednesday, and after Friday’s highly anticipated US Non-Farm Payrolls (NFP). Significantly, the usual volatility seen after the completion of a quarter/half year and NFP may be deferred to after most traders return from the US Independance Day long weekend holiday next Tuesday…
Soybean (ZS) Breaking Daily Chart Descending Wedge Resistance
Soybean (ZS) is trying to stabilize to start the week, bouncing off a near complete wedge/triangle’s support (on the 4hr chart) and trying to break decisively above descending wedge resistance (on the daily chart). Significantly, regardless of the high probability for a multi-day bounce, ZS will remain vulnerable to a Bear Flag extension in July while ZS sits below uptrend support (on the weekly chart)…
Ethereum (ETHUSD) Tries Bouncing Off 61.8% Fib Retrace of Mar20-May21 Rally
Register/Login to view Crypto Weekly Outlook (ETHUSD | BTCUSD | XRPUSD). Crypto Weekly Outlook covers crypto industry fundamentals and technicals/fundamentals on Bitcoin, Ethereum and Ripple, updated Sundays. Free Members had access to this Preview of Sep 20, 2020’s 26 page report Today’s Top 3 Trades, Equities & ETFs, Coffee Daily, Crypto Weekly Outlook and allRead More
Cotton (CT) 3 Month Plus Consolidation Near Complete
Cotton (CT) is digesting this week’s gains as it approaches the June high, consolidating near triangle resistance (on the weekly chart). Significantly, CT appears poised to continue a bull market after a 3 plus month triangle (on the weekly chart), with odds elevated for a test of the 2021 high by July sometime…
USDCHF Weekly MACD Positively Crossing
The USDCHF appears to be completing a 3 day descending triangle and Bull Flag consolidation (on the 4hr chart). Significantly, the powerful bounce last week off upchannel support (on the weekly chart) is poised to continue, reflecting the strong momentum in the USDCHF’s major new uptrend…
Natural Gas (NG) Tries Extending 2 Month Plus Upchannel
Natural Gas (NG) is consolidating yesterday’s strong gains as it approaches the 2021 high ahead of Thursday’s highly anticipated weekly storage data release. Significantly, NG is arguably in a Bull Flag where the past week plus of triangle (on the daily chart) represents the flag’s consolidation…
S&P500 (ES) Back to Near Record High Ahead of Powell’s Comments
The S&P500 (ES) reversed Friday’s losses yesterday, and is once again just a few day’s volatility of the June and record high. Significantly, although ES has clawed back to prior ascending wedge resistance (on the weekly chart), the ES remains vulnerable in the day or so following today’s highly anticipated Powell comments at 2pm EST to a retest of Monday’s low…
Soybean (ZS) Breaking Weekly Chart Uptrend Support
Soybean (ZS) is trying to stabilize for a 2nd straight day to start the week, testing downchannel resistance (on the 4hr chart) and downtrend/descending wedge resistance (on the daily chart). Significantly, ZS remains vulnerable to a Bear Flag extension by late this week after having broken below the May low and uptrend support (on the weekly chart) last week…
Ethereum (ETHUSD) Breaks Weekly Chart Upchannel Support
Ethereum (ETHUSD) is looking wobbly as it breaks upchannel support (on the daily and weekly chart), dramatically increasing the likelihood of a retest of the psychologically key 2k whole figure level in the next week or so. Significantly, the bounces in the past month have capped at near the 38.2% Fib retrace of the March 2020 to May 2021 rally, forming a right shoulderÂlike pattern to a Head and Shoulders (seen more easily on the daily chart)…