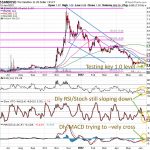
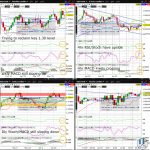
The USDCAD is trying to halt the pullback that began at the 2022 high a bit more than a week ago, with the weekly Hammer assuring a higher June low versus the May low. Any break of the downchannel resistance (on the 4hr chart) will dramatically increase the likelihood of reclaiming the psychologically key 1.30 whole figure level and 2022 high in the few days after…
Month: June 2022
Natural Gas (NG) Retesting 50% Fib Retrace of Jan-Jun Bull Market Extension
Natural Gas (NG) is trying to slow the massive slide from the 2022 peak (a few weeks back), but remains vulnerable to deepening in its correction. With NG still below upchannel support (on the weekly chart), odds are high for a retest by early July of the 61.8% Fib retrace of the Bull Market extension from the 2022 low (in January) to the 2022 high in June…
Nasdaq100 (NQ) Retesting Weekly Chart Descending Wedge Resistance
The Nasdaq100 (NQ) is catching its breath in its Dead Cat Bounce, and appears poised for more upside in July. A weekly close above the psychologically key 12k whole figure level and the downtrend resistance (on the weekly chart from April to June) will likely coincide with a daily close above the daily chart downchannel resistance…
Soybean (ZS) Testing 50% Fib Retrace of Nov-Jun Bull Market Extension
Register/Login to freely access technical analysis on the market described in the headline above. Today’s Top 3 Trades includes technical analysis on: Agris (Soybean | Corn) + Today’s Top Trade (GBPAUD) Join the world’s largest asset manager and 2 of the world’s 5 largest (and 5 of the 10 largest) hedge funds by AUM asRead More
Sandbox (SAND) Breaking 6 Month+ Descending Wedge Resistance
TOP50’sTOP10 (SANDUSD, MANAUSD, DOTUSD, MATICUSD, SOLUSD, XTZUSD, FTTUSD, ATOMUSD, CROUSD, AVAXUSD)
Cotton (CT) Suffers Biggest Weekly Loss Since 2011
Cotton (CT) is trying to form its 5th straight red daily candle as part of the biggest weekly drop since at least June 2011. Although odds are decent that the break below the psychologically key 1 whole figure level is an overshoot and false break, CT appears to still be weighed by a gravitational pull towards the 61.8% Fib retrace of the April 2020 to May 2022 bull market (as can be seen on tradingview.com)…
GBPAUD Weekly MACD Positively Crossing
The GBPAUD is in the advanced stages of a major bottom that began in April with the effort underway to form a higher June low versus the May low. Odds are high for the GBPAUD to break above the April / May high before month end, regardless of the near complete ascending wedge (on the 4hr chart)…
WTI Crude (CL) Nearing Weekly Chart Ascending Wedge Support
WTI Crude (CL) is looking vulnerable to sliding further going into July after last week’s tumble from a fresh 2022 high and the psychologically key 120 whole figure level. CL is suddenly hovering precariously just above upchannel support (on the daily chart) and ascending wedge support (on the weekly chart)…
Nasdaq100 (NQ) Daily MACD Trying to Positively Cross
The Nasdaq100 (NQ) appears to be in the early stages of forming a multi-month low, with the current green weekly candle trying to rebound off downchannel support (on the weekly chart). Any break above last week’s high will dramatically increase odds for a daily close above the psychologically key 12k whole figure level by the weekend…
Soybean (ZS) Weekly MACD Negatively Crossing
Soybean (ZS) is showing exhaustion after selling off last week following a fresh 2022 high the week prior. Any break below descending triangle support (on the 4hr chart) will likely coincide with a slide below ascending triangle support (on the weekly chart)…