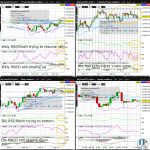
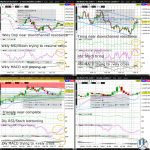
Nasdaq100 (NQ) is consolidating after surging more than 2.5% yesterday, and is trying to complete its 4th straight weekly Hammer or Doji. NQ is arguably back in the advanced stages of a Bull Flag near the 2023 high (formed in April), where it appears to be gearing up to retest in May, the weekly chart ascending wedge resistance and the 50% Fib retrace of the bear market from the November 2021 high (as can be seen more easily on a weekly chart on tradingview.com)…
Tag: NQ_F
Nasdaq100 (NQ) Continues 3 Week Consolidation Near 2023 High
Nasdaq100 (NQ) is struggling to extend a Bull Flag near the 2023 high (formed in April). With NQ just above the 38.2% Fib retrace of the bear market from the November 2021 high (as can be seen more easily on a weekly chart on tradingview.com), NQ is appearing increasingly unlikely to muster enough upward momentum in its rally off the October low to make a final push by May sometime to upchannel resistance (on the weekly chart)…
S&P500 (ES) Tries Forming 3rd Straight Weekly Doji Near 2023 High
The S&P500 (ES) is consolidating after forming a fresh April high (Tuesday), beginning to struggle as it slips back beneath the 50% Fib retrace of the slide from the January 2022 high to October 2022 low (as can be seen more easily on a weekly chart on tradingview.com). Nevertheless, any regaining of the 2023 high formed February before month end will dramatically increase odds of testing the August high by May sometime…
S&P500 (ES) Testing 50% Fib Retrace of Jan’22-Oct’22 Slide
The S&P500 (ES) is consolidating near a fresh April high, hesitating as it tests the 50% Fib retrace of the slide from the January 2022 high to October 2022 low (as can be seen more easily on a weekly chart on tradingview.com), and nears the 2023 high formed February. Further creating caution is ES bumping up against a downtrend resistance (on the weekly chart)…
S&P500 (ES) Weekly Hammer Nears 2023 High
The S&P500 (ES) is consolidating just shy of the April and February high, forming a weekly Hammer just below downtrend resistance (on the weekly chart). ES now appears more likely to test the August high in April than the psychologically key 4k whole figure level…
Nasdaq100 (NQ) Weekly Doji Near Weekly Chart Downchannel Resistance
Nasdaq100 (NQ) is consolidating Friday’s bounce, hesitating as seen by the weekly Doji forming just above the psychologically key 12k whole figure level. Any break above the 4hr chart downchannel resistance this week will likely coincide with a retest of triangle resistance (on the daily chart)…
S&P500 (ES) Weekly Doji Tries Forming Just Below Key 4K Level
The S&P500 (ES) is consolidating after yesterday’s bounce, but remains wobbly going into next week with a weekly Doji trying to form just below the Oct-Feb uptrend support (on the weekly chart). Any weekly close below the psychologically key 4k whole figure level would reinforce the idea that the slightly higher February high versus the January and December highs was a bear trap…
VIX (VX) Reclaims Key 20 Level Ahead of FOMC
The VIX (VX) is trying to halt the slide from October by rebounding off last week’s fresh 2023 low. Before bulls get excited, the VX will need a daily close above downchannel resistance (on the daily chart)…
S&P500 (ES) Testing Weekly Chart Downchannel Resistance
The S&P500 (ES) is consolidating after the strong reversal off the Wednesday Hammer low, hesitating as it bumps against downchannel resistance (on the weekly chart). Although odds are elevated for a weekly close above this key bear-bull battle ground, a break above the weekly chart downchannel resistance could very well be brief with the highly anticipated FOMC and Fed rate announcement Wednesday potentially setting up for a slide back into the same downchannel…
Nasdaq100 (NQ) Breaks Weekly Chart Descending Wedge Resistance
Nasdaq100 (NQ) is consolidating after yesterday’s massive 2% plus surge, but is likely to grind higher to the psychologically key 12k whole figure level and upchannel resistance (on the 4hr chart) in the next day or so. Odds are suddenly moderately high and increasing that yesterday’s break above the weekly chart descending wedge resistance ends the 2022 bear…