Trade Better with
Tradable Patterns
Login/Register to preview:
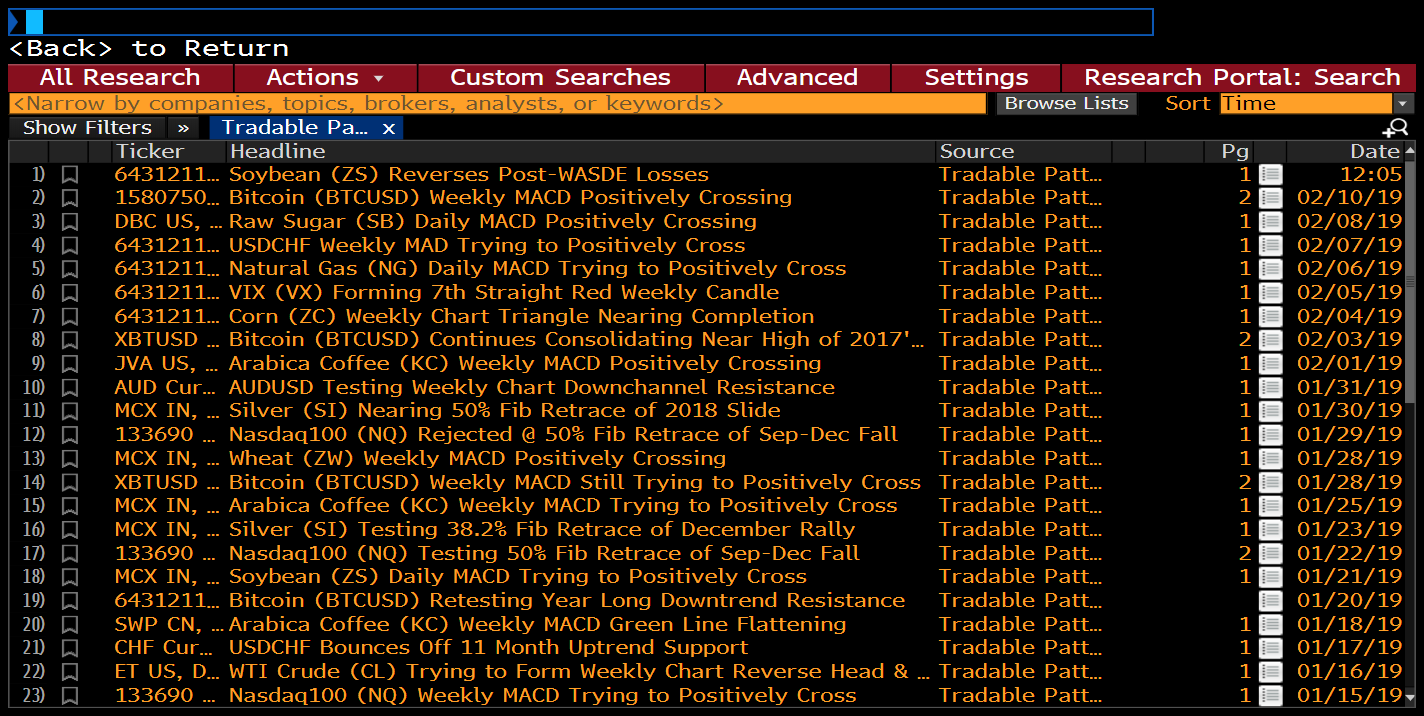
Softs: ICE Coffee, Cocoa, Sugar daily technical analysis
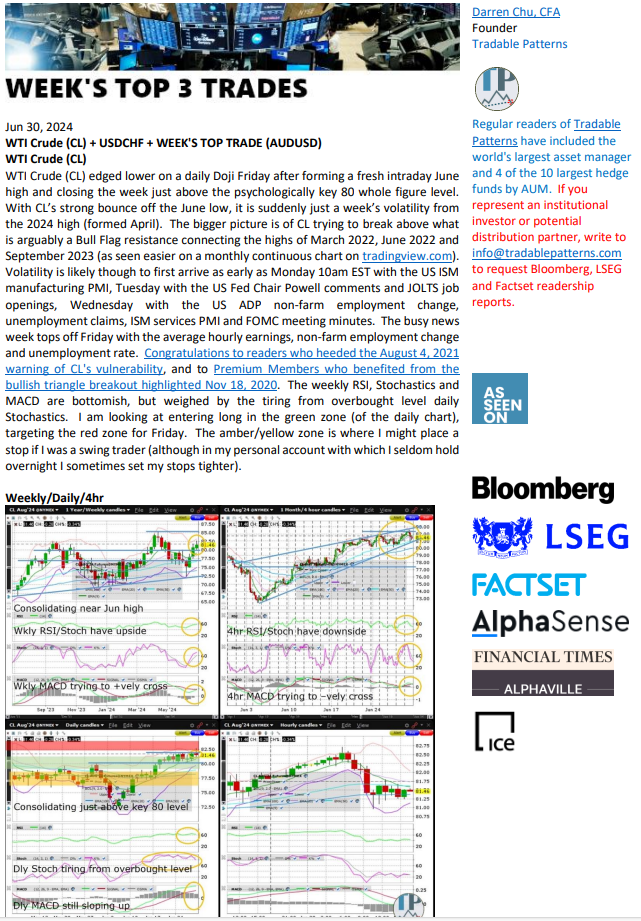
Week’s Top 3 Trades: CME/ICE futures/FX weekly technical analysis
Curious about Hedge Funds, VC funds, PE, Credit, Seed-Series B Startups, Tech Unicorns or Real Estate/Hotels?
We regularly speak with family offices, conglomerates, hedge funds, fund of funds, VC funds, SMEs, tech startups and those looking for tech unicorns.
Mon-Fri Coffee/Cocoa/Sugar Reports
Daily softs technical analysis content geared towards commodity trading houses, food conglomerates and brokerages.
Private Credit
Gain insights into direct lending opportunities in ASEAN.
Tech Unicorns
Looking for the most popular tech unicorns? Write to [email protected] or WA +65 8118 8840 if you have access to Bytedance, Anthropic, Anduril, Neuralink or Stripe.
Emerging Hedge Fund, VC Funds
Opportunities in quantitative hedge fund/managed futures, DeFi yield farming and VC funds (sector agnostic / crypto).
Private Equity
Interested in acquiring healthcare, hospitality, education, tech or financial businesses? Tradable Patterns is connected to owners of Asia-based 4-5 star hotels, high end and mid market F&B chains, clinics, education/training businesses, semiconductor and investment brokerages seeking an exit or growth capital.
Tradable Patterns is also on the hunt for a number of buyout targets on behalf of coroporates, PE groups and family offices
Tech Startups
Learn about exciting tech startups (Seed-Series B) based in ASEAN region (half in Singapore) in fintech, agritech, clean energy and impact/sustainability, medtech, biotech, edtech, traveltech, AI, e-commerce, SAAS and semiconductors.
Why Tradable Patterns?
Tradable Patterns has written about cross asset market cycles for 11+ years as seen in daily futures/FX/crypto newsletters).
Tradable Patterns has strong relationships within trading, hedge fund, VC, PE, private credit, tech startup and family office ecosystems.
Why Technical Analysis (TA)?
- Fundamental analysis alone is terrible for timing trades/investments
- TA helps provide objectivity and rules around entries/exits
- TA incorporates everything public and private known about a market, and can be helpful for spotting insider actions (accumulation/dumping)
Tap into Asia Growth
- Singapore where Tradable Patterns is based, offers a deep ecosystem of financial and commodity industry providers, tech startups, VC funds, hedge funds and is also connected to numerous other opportunities in established growth industries (via Private Equity, Private Credit, Real Estate/Hotel)
- Experience growth in Asia starting with SE Asia, HQed from Singapore