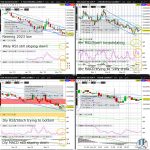
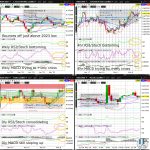
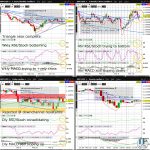
The USDCHF is consolidating after surging from Monday’s low, hesitating at triangle resistance (on the daily chart) and digesting this week’s break above descending wedge resistance (on the weekly chart). With the USDCHF comfortably above the psychologically key 0.90 whole figure level, odds are decent for renewed momentum next week in the bounce off the 2023 low and the weekly chart descending wedge support…
Tag: USDCHF
VIX (VX) Tests Daily Chart Descending Wedge Resistance
The VIX (VX) is consolidating Friday’s bounce off the fresh 2023 low, but remains at moderately low risk of sliding further this week to the daily chart descending wedge support one final time. Any break above downchannel resistance (on the 4hr chart) in the next few days will likely coincide with a reclaiming of the psychologically key 20 whole figure level…
S&P500 (ES) Consolidates After Surging to New 2023 High
The S&P500 (ES) is consolidating after surging for 2 straight days to a fresh 2023 high and triangle resistance (on the weekly chart). Odds are now elevated for the ES to join the NQ in gravitating to the 61.8% Fib retrace of the slide from the January 2022 high to October 2022 low (as can be seen more easily on a weekly chart on tradingview.com) by month end…
USDCHF Consolidates Just Under Weekly Chart Descending Wedge Resistance
The USDCHF is consolidating yesterday’s break above the psychologically key 0.90 whole figure level, and appears poised to test by next week sometime, descending wedge resistance (on the weekly chart). The USDCHF has made progress in its bottoming effort off the 2023 low and the weekly chart descending wedge support…
VIX (VX) Tests 2023 Low Ahead of US Retail Sales
The VIX (VX) is testing the 2023 low formed early May, with any further downside today dramatically increasing the odds of testing the daily chart downchannel support in the week after. Nevertheless, the VX is arguably in the advanced stages of a descending wedge (on the 4hr chart), with a short covering this week back to downchannel resistance (on the daily chart) and the psychologically key 20 whole figure level moderately likely…
Wheat (ZW) Trying to Bounce Off Weekly Chart Descending Wedge Support
Wheat (ZW) is trying to firm to start the week, but appears likely to consolidate another day or so after Friday’s rejection post-WASDE at triangle resistance (on the 4hr chart). Before bulls get excited, they’ll want to see ZW break above downchannel resistance (on the daily chart), which if successful would dramatically increase odds of breaking descending wedge resistance (on the weekly chart) in the week after…
AUDUSD Consolidates Just Shy of April, May Highs
The AUDUSD is consolidating for a 3rd straight day near the May and April high. Odds are elevated for the AUDUSD to resume by next week, its bounce off just above the 2023 low…
Nasdaq100 (NQ) Nears 50% Fib Retrace of Nov’21-Oct’22 Slide
Nasdaq100 (NQ) is consolidating just shy of the 2023 high, arguably in the advanced stages of a Bull Flag consolidation that began early April. Odds are elevated for a retest this week, of the weekly chart ascending wedge resistance and the 50% Fib retrace of the bear market from the November 2021 high (as can be seen more easily on a weekly chart on tradingview.com)…
Soybean (ZS) Rebounds Above Key 1500 Level From New 2023 Low
Soybean (ZS) is consolidating to start the week following last week’s strong rebound off a fresh 2023 low. ZS is suddenly nearing its March high, but will likely spend this week catching its breath ahead of next Monday’s highly anticipated WASDE…
GBPUSD Tries Halting Daily Chart Downchannel Near Key 1.20 Level
The GBPUSD is trying to firm after getting rejected at downchannel resistance (on the daily chart) and sliding roughly 100 pips. Regardless of any further profittaking in the next day or so, odds are elevated for a resumption of the rally off last week’s fresh 2023 low to the 2023 high by April sometime…