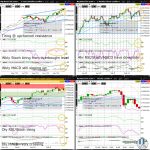
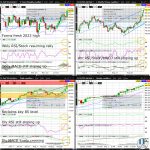
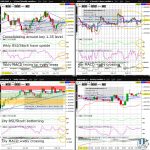
Corn (ZC) Testing Weekly Chart Descending Wedge Resistance

Corn (ZC) edged lower Friday, closing the week at what is arguably descending wedge resistance (on the weekly chart). With the prior week’s weekly Hammer’s long lower shadow reversal from the 2023 low (along with the November Hammer doing the same as can be seen more easily on a monthly chart on tradingview.com), odds are decent that ZC is in the early stages of forming a major bottom (now that the December WASDE released Friday is out of the way)…

Gold (GC) Reclaims Key 2K Level

Gold (GC) formed a daily Gravestone Friday with its weekly Hammer consolidating the prior week’s decisive break above downchannel resistance (on the weekly chart). With GC testing the August high and psychologically key 2000 whole figure level, GC is near complete in its Bull Flag consolidation since August 2020 (as can be seen more easily on a monthly chart on tradingview.com)…

Soybean (ZS) Testing Weekly Chart Descending Wedge Resistance

Soybean (ZS) is trying to gain for a 3rd straight day after a sharp reversal off a fresh 2023 low (just below the 2022 low), but is likely to see a bit of healthy consolidation in the next day or so. Any break above downchannel resistance (on the 4hr and daily chart) will likely have to wait until at least late week, and would dramatically reduce the odds of a test by Q3 sometime of the 2021 low (formed that November) near the 61.8% Fib retrace of the May 2019 to June 2022 bull market (as can be seen more easily on a monthly chart on tradingview.com)….

USDCHF Weekly MACD Positively Crossing

The USDCHF is consolidating just below the April high after last week’s decisive breakout above descending wedge resistance (on the weekly chart). Nevertheless, the bounce off the 2023 low and the weekly chart descending wedge support to well above the psychologically key 0.90 whole figure level appears to have formed a major bottom (as can be seen easier on a monthly chart on tradingview.com)…