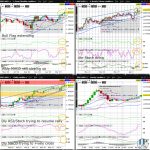
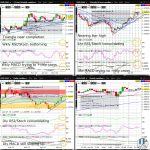
The USDCAD is consolidating after the strong gains of the past 2 weeks, but appears to have upside momentum to gravitate to triangle resistance (on the weekly chart) by early May sometime. With the USDCAD comfortably back above the psychologically key 1.35 whole figure level, the USDCAD is arguably in the advanced stages of the weekly chart triangle which is arguably a Bull Flag consolidation (as can be seen easier on a monthly chart on tradingview.com)…
Tag: USDCAD
GBPAUD Weekly Chart Bull Flag Extends to Fresh 2023 High
The GBPAUD is extending an upchannel (on the 4hr and daily chart), appearing to have a bit more upside going into the weekend before its weekly chart Bull Flag begins consolidating again. With the GBPAUD having formed a fresh 2023 high yesterday, any healthy profittaking going into next week will likely find initial support at the psychologically key 1.85 whole figure level…
GBPAUD Near 2023 High Ahead of UK GDP
The GBPAUD is hesitating within a key bull-bear battleground, testing the psychologically key 1.80 whole figure level, 2023 high and ascending triangle resistance (on the 4hr chart). Odds appear elevated for a surge in March to the December high and major downchannel resistance since March 2020 (as can be seen easier on a monthly chart on tradingview.com)…
GBPAUD Weekly MACD Trying to Positively Cross
The GBPAUD is consolidating after the massive 350 pip or so gain from the Tuesday low to yesterday’s high, with decent odds now of testing the psychologically key 1.80 whole figure level and the 50% Fib retrace of the February to September slide by early March. Although the GBPAUD has halted the slide since the December high, it remains within a major downchannel since March 2020 (as can be seen easier on a monthly chart on tradingview.com)…
S&P500 (ES) Retesting Weekly Chart Downchannel Resistance
The S&P500 (ES) is looking wobbly as it has arguably slid under an uptrend support (on the daily chart). Odds are fairly low for a fresh February high before month end, with ES appearing like it will slide back into the downchannel (on the weekly chart) by mid week…
GBPAUD 3rd Weekly Doji Just Below 50% Fib Retrace of Feb-Sep Slide
The GBPAUD is forming a 3rd straight weekly Doji just below the 50% Fib retrace of the February to September slide. With volatility about to surge as hinted by the near complete triangle (on the 4hr and daily chart), the question is whether the triangle resolves lower, extending the pullback from the December high…
USDCAD Weekly Chart Triangle Near Complete
The USDCAD continues consolidating but should be seeing a volatility surge soon as the triangle (on the weekly chart) nears completion. Before bulls get excited, they’ll want to see the USDCAD close on a weekly basis above the weekly chart triangle resistance and the psychologically key 1.35 whole figure level…
USDCAD Trying to Form Higher Jan Low VS Nov Low
Register/Login to freely access technical analysis on the market described in the headline above. Today’s Top 3 Trades includes technical analysis on: FX (USDCAD | GBPAUD) + Today’s Top Trade (Silver) Join the world’s largest asset manager and 3 of the world’s 5 largest (and 5 of the 10 largest) hedge funds by AUM asRead More
USDCAD Testing 61.8% Fib Retrace of Oct-Nov Slide
The USDCAD has bounced strongly off the November low, and is suddenly testing the 61.8% Fib retrace of the October to November slide. For now, the USDCAD appears to want to complete the Bull Flag consolidation since the October high, and retest the 2022 high and the psychologically key 1.40 whole figure level by January sometime…
USDCAD Nearing 2022 High Ahead of NFP
The USDCAD is nearing the 2022 high, with the catalyst for forming a fresh 2022 high arriving as early as today following the 10am EST US ISM manufacturing PMI. More likely though is for any break to occur only after Friday’s highly anticipated US Non-Farm Payrolls and unemployment rate…