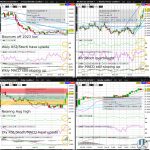
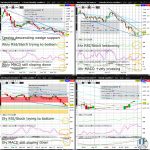
USDCHF Weekly MACD Positively Crossing

The USDCHF is consolidating just below the April high after last week’s decisive breakout above descending wedge resistance (on the weekly chart). Nevertheless, the bounce off the 2023 low and the weekly chart descending wedge support to well above the psychologically key 0.90 whole figure level appears to have formed a major bottom (as can be seen easier on a monthly chart on tradingview.com)…

VIX (VX) Bounce Off 2023 Low Testing Key 20 Level

The VIX (VX) is consolidating for a second straight day Wednesday’s surge, appearing poised to continue next week efforts at a major bottom with the green weekly Tombstone trying to bounce off the 2023 low. Any break today above downchannel resistance (on the 4hr chart) and descending wedge resistance (on the daily chart) will dramatically increase odds next week of a break of the weekly chart descending wedge resistance….

USDCHF Breaks Weekly Chart Descending Wedge Resistance

The USDCHF is consolidating after surging from Monday’s low, hesitating at triangle resistance (on the daily chart) and digesting this week’s break above descending wedge resistance (on the weekly chart). With the USDCHF comfortably above the psychologically key 0.90 whole figure level, odds are decent for renewed momentum next week in the bounce off the 2023 low and the weekly chart descending wedge support…

USDCAD Weekly Chart Triangle Since October Near Complete

The USDCAD is consolidating after the strong gains of the past 2 weeks, but appears to have upside momentum to gravitate to triangle resistance (on the weekly chart) by early May sometime. With the USDCAD comfortably back above the psychologically key 1.35 whole figure level, the USDCAD is arguably in the advanced stages of the weekly chart triangle which is arguably a Bull Flag consolidation (as can be seen easier on a monthly chart on tradingview.com)…

GBPAUD Near 2023 High Ahead of UK GDP

The GBPAUD is hesitating within a key bull-bear battleground, testing the psychologically key 1.80 whole figure level, 2023 high and ascending triangle resistance (on the 4hr chart). Odds appear elevated for a surge in March to the December high and major downchannel resistance since March 2020 (as can be seen easier on a monthly chart on tradingview.com)…

GBPAUD Weekly MACD Trying to Positively Cross

The GBPAUD is consolidating after the massive 350 pip or so gain from the Tuesday low to yesterday’s high, with decent odds now of testing the psychologically key 1.80 whole figure level and the 50% Fib retrace of the February to September slide by early March. Although the GBPAUD has halted the slide since the December high, it remains within a major downchannel since March 2020 (as can be seen easier on a monthly chart on tradingview.com)…