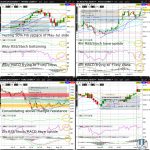
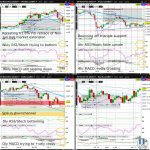
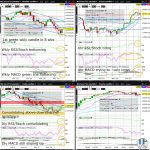
Corn (ZC)’s bounce off the July low appears to have ended for now with last week’s weekly Doji closing around the 50% Fib retrace of the May to July slide. ZC has also bumped up against what is arguably triangle resistance (on the daily and weekly chart)…
Tag: Soybean
Corn (ZC) Testing 50% Fib Retrace of May-Jul Slide
Corn (ZC) is consolidating just above triangle resistance (on the daily chart) to start the week, testing the highest level since July. With ZC having reclaimed the 50% Fib retrace of the May to July slide, ZC appears to be gearing up for a retest of the 2022 high before year end…
Corn (ZC) Daily Chart Triangle Near Complete
Corn (ZC) is in the advanced stages of a triangle (on the daily chart), where odds are improving for the July low to hold the balance of August. ZC remains shaky nevertheless where a break below the daily chart triangle support and psychologically key 600 whole figure level would likely be followed in the week after by a test of the July low…
Wheat (ZW) Weekly Chart Descending Wedge Near Complete
Wheat (ZW) is trying to halt the deep slide since the 2022 peak in May. With the near completion on a descending wedge (on the daily chart), and ZW testing the 2022 low, odds are elevated for a bullish resolution post-WASDE to the near complete weekly chart triangle…
Soybean (ZS) Testing 61.8% Fib Retrace of Jun-Jul Slide
Soybean (ZS) is tiring after last week’s massive rebound, with ZS just shy of the psychologically key 1500 level. ZS appears vulnerable to breaking upchannel support (on the 4hr chart) in the next few days, and will likely want to spend the next week or so catching its breath near the 50% Fib retrace of the June to July slide…
Soybean (ZS) Retesting 61.8% Fib Retrace of Nov-Jun Bull Market Extension
Soybean (ZS) is trying to halt its slide from the June peak, but remains vulnerable this week to completing the 4hr chart triangle to the downside effectively continuing a Bear flag or downchannel (on the daily chart). Nevertheless, bears should not rule out short covering with ZS trying to bounce off the 61.8% Fib retrace of the November to June bull market extension…
Corn (ZC) Nearing Key 600 Level
Corn (ZC) slid another 1% Friday adding to the steep losses since breaking upchannel support (on the weekly chart) 2 weeks ago. ZC is beginning to appear it may have overshot to the downside with Thursday’s break below downtrend support (on the daily chart)…
Soybean (ZS) Testing 50% Fib Retrace of Nov-Jun Bull Market Extension
Register/Login to freely access technical analysis on the market described in the headline above. Today’s Top 3 Trades includes technical analysis on: Agris (Soybean | Corn) + Today’s Top Trade (GBPAUD) Join the world’s largest asset manager and 2 of the world’s 5 largest (and 5 of the 10 largest) hedge funds by AUM asRead More
Soybean (ZS) Weekly MACD Negatively Crossing
Soybean (ZS) is showing exhaustion after selling off last week following a fresh 2022 high the week prior. Any break below descending triangle support (on the 4hr chart) will likely coincide with a slide below ascending triangle support (on the weekly chart)…
Nasdaq100 (NQ) Consolidates Above Daily Chart Downchannel Resistance
The Nasdaq100 (NQ) has bounced off downchannel support (on the daily and weekly chart) and is in the early stages of a bear market rally. Odds are high for a test by June sometime of the 38.2% Fib retrace of the January-May slide, while the probability of testing the 50% Fib coinciding with downchannel resistance (on the weekly chart) in the same period is moderately low…