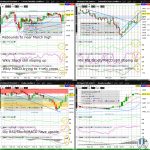
Wheat (ZW) Weekly Chart Descending Wedge Near Complete

Wheat (ZW) is consolidating near the psychologically key 700 whole figure level after bouncing off the 2023 low (formed a bit more than a week ago). Odds are moderate for a break of descending wedge resistance (on the weekly chart) before month end, which if successful, would neutralize the bear trend since the May high and dramatically increase the likelihood of ZW retesting the February high in the week after…

Wheat (ZW) Tries Bouncing Off Weekly Chart Descending Wedge Support

Wheat (ZW) is consolidating Friday’s bounce off a fresh 2023 low and descending wedge support (on the weekly chart) to start the week. Any break above the 4hr chart downchannel resistance in the next day or so would coincide with decisive gains above descending wedge resistance (on the daily chart), and dramatically increase odds of a test of the psychologically key 700 whole figure level in the day or so after…

Wheat (ZW) Nearing Weekly Chart Descending Wedge Support

Wheat (ZW) is starting the week continuing a consolidation near the 2022 low, remaining vulnerable to a deeper slide towards descending wedge support (on the weekly chart) in January. With ZW below the 61.8% Fib retrace of the September 2016 to March 2022 bull market (as can be seen on a monthly chart on tradingview.com), odds are moderate for a sliding back to the 2021 low just below the psychologically key 600 whole figure level sometime in Q1…