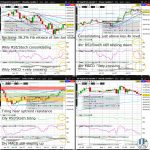
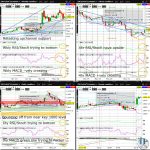
GBPUSD Broke Weekly Chart Descending Wedge Resistance

The GBPUSD is making progress in forming a major bottom after bouncing off the psychologically key 1.20 whole figure level yesterday and surging above descending wedge resistance (on the weekly chart). Although odds are decent for a break to a fresh July high following the 830am EST release of the US advance GDP data and Friday’s US core PCE price index data, bulls should be prepared for a lower probability of a brief pullback before the weekend potentially to upchannel support (on the 4hr chart)…

Wheat (ZW) Tries Bouncing Off 61.8% Fib Retrace of Dec16-Feb22 Bull Market

Wheat (ZW) is gapping up almost 3% to start the week, trying to halt the slide since the 2022 peak in May. Although ZW remains vulnerable to sliding to downchannel support (on the daily chart) in the next week, odds are higher for ZW to bounce from current levels which coincide with the 61.8% Fib retrace of the December 2016 to February 2022 bull market (as can be seen on tradingview.com)…

Cotton (CT) Suffers Biggest Weekly Loss Since 2011

Cotton (CT) is trying to form its 5th straight red daily candle as part of the biggest weekly drop since at least June 2011. Although odds are decent that the break below the psychologically key 1 whole figure level is an overshoot and false break, CT appears to still be weighed by a gravitational pull towards the 61.8% Fib retrace of the April 2020 to May 2022 bull market (as can be seen on tradingview.com)…

Wheat Retesting Weekly Chart Upchannel Support Ahead of WASDE

Wheat (ZW) is trying to firm after a 3 week slide from the 2022 high, but remains vulnerable to retesting the psychologically key 1000 whole figure level and the 50% Fib retrace of the January to March bull market extension. Nevertheless, any break above downchannel resistance (on the 4hr chart) would dramatically increase the odds for a sustainable bounce off upchannel support (on the weekly chart)…