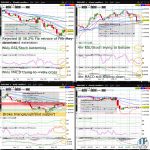
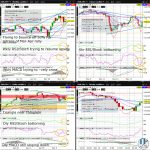
The Nasdaq100 (NQ) is catching its breath in its Dead Cat Bounce, and appears poised for more upside in July. A weekly close above the psychologically key 12k whole figure level and the downtrend resistance (on the weekly chart from April to June) will likely coincide with a daily close above the daily chart downchannel resistance…
Tag: EURUSD
GBPAUD Weekly MACD Positively Crossing
The GBPAUD is in the advanced stages of a major bottom that began in April with the effort underway to form a higher June low versus the May low. Odds are high for the GBPAUD to break above the April / May high before month end, regardless of the near complete ascending wedge (on the 4hr chart)…
Arabica Coffee (KC) Back Above Weekly Chart Upchannel Support
Arabica Coffee (KC) gained another more than 1.5% yesterday, extending the rebound off upchannel support (on the 4hr, daily and weekly chart). With a near complete green weekly Hammer above upchannel support (on the weekly chart), odds are elevated for KC to form a fresh June high before month end…
GBPAUD Daily MACD Trying to Positively Cross
The GBPAUD is breaking out of the bottoming formation that began early week, and is suddenly back to near the psychologically key 1.75 whole figure level. A higher June low versus the May low would strongly reinforce the major bottoming effort since early April…
Arabica Coffee (KC) Bull Flag Consolidation Since Mid Feb Completing
Arabica Coffee (KC) formed a daily Doji yesterday, hesitating in its strong 3 week plus rally as it tests upchannel resistance (on the 4hr chart). Significantly, KC’s upchannel extension (on the weekly chart) remains above the April high, but is likely to continue consolidating going into early next week before the rally can extend from the current 61.8% Fib retrace of the slide from the February high to the May low…
EURUSD Rejected @ Weekly Chart Downchannel Resistance
The EURUSD has broken the daily chart triangle/uptrend support, and is increasingly vulnerable to a retest of the psychologically key 1.05 whole figure level by early next week. Nevertheless, the EURUSD does not appear likely to retest the May low / 2017 low (as can be seen on tradingview.com) in June, with odds higher for a weekly close above the 38.2% Fib retrace of the February to May downtrend extension in the same period…
Soybean (ZS) Retesting Weekly Chart Ascending Triangle Resistance
Soybean (ZS) is hesitating as it retests ascending triangle resistance (on the weekly chart). When ZS reopens after a shortened holiday session, ZS could briefly burst to a fresh 2022 high, although healthy profittaking will likely kick in by mid week given that ZS is nearing upchannel resistance (on the 4hr chart)…
EURUSD Testing 38.2% Fib Retrace of Feb-May Downtrend Extension
The EURUSD is forming its 2nd straight green weekly candle, and has arguably halted its downtrend (on the weekly chart). With the EURUSD trying to bounce off uptrend support (on the 4hr chart), odds are high for a break above the 38.2% Fib retrace of the February to May downtrend extension before month end…
Soybean (ZS) Consolidating Just Below 2022 High
Soybean (ZS) is hesitating to start the week, and appears ready to consolidate the strong gains over the past 2 weeks. Nevertheless, with the ascending triangle (on the weekly chart) in its advanced stages, any break to a fresh 2022 high will dramatically increase the likelihood of a retest of the 2012 record high in the week after…
EURJPY Weekly MACD Trying to Negatively Cross
The EURJPY is trying to halt the slide from the April high, bouncing yesterday off the 38.2% Fib retrace of the March to April rally. Nevertheless, the EURJPY remains vulnerable as a volatility spike is likely to be seen by early next week with the triangle (on the 4hr and daily chart) near complete…