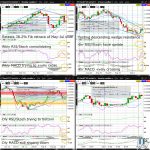
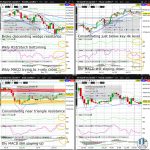
Cocoa (CC) bounced more than 1.5% yesterday, closing back above the psychologically key 2300 whole figure level. With the near complete weekly Doji, odds are now elevated for a higher Oct low versus the September low…
Cocoa (CC) bounced more than 1.5% yesterday, closing back above the psychologically key 2300 whole figure level. With the near complete weekly Doji, odds are now elevated for a higher Oct low versus the September low…
The EURUSD is consolidating after the strong bounce from the 2022 low (in September), and is at risk of seeing more healthy profittaking today as it bumps up against downchannel resistance (on the weekly chart). Regardless of any deeper pullback today, the EURUSD is progressing at forming a major bottom, with a high likelihood of a weekly close above the psychologically key 1.00 whole figure level…
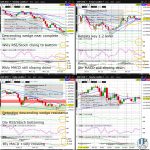
The S&P500 (ES) is consolidating after the bounce in the past week, pausing as it bumps against the October high. Odds are suddenly high for a Dead Cat Bounce to continue for much of November, and for a test of the psychologically key 4k whole figure level by early November…
Nasdaq100 (NQ) is slowing in its bounce off last week’s low, hesitating as what is arguably an ascending wedge (on the 4hr chart) nears completion. Nevertheless, NQ appears poised to at least test downtrend resistance (on the weekly chart) this week, where any recapture of the August high this month will likely extend the Dead Cat Bounce that began in June into October…
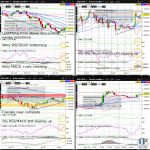
Cotton (CT) is firming up, trying to halt last week’s healthy profittaking. Any break above descending wedge resistance (on the 4hr chart) will decisively bring CT back into the daily chart upchannel…
Register/Login to freely access technical analysis on the market described in the headline above. Today’s Top 3 Trades includes technical analysis on: FX (GBPAUD | EURUSD) + Today’s Top Trade (Wheat) Join the world’s largest asset manager and 2 of the world’s 5 largest (and 5 of the 10 largest) hedge funds by AUM asRead More
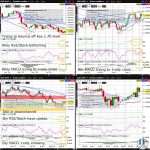
The GBPUSD surged more than 200 pips yesterday from the day’s low to high, and is now retesting triangle resistance (on the daily chart). With the GBPUSD near complete in its consolidation just above descending wedge resistance (on the weekly chart), the major bottom that began forming in July is now in its advanced stages…
The GBPUSD is making progress in forming a major bottom after bouncing off the psychologically key 1.20 whole figure level yesterday and surging above descending wedge resistance (on the weekly chart). Although odds are decent for a break to a fresh July high following the 830am EST release of the US advance GDP data and Friday’s US core PCE price index data, bulls should be prepared for a lower probability of a brief pullback before the weekend potentially to upchannel support (on the 4hr chart)…
The S&P500 (ES) is hesitating in its effort at forming a multi-month low after arguably forming a second data point on a triangle resistance (on the daily chart). Nevertheless, ES appears to be merely consolidating its break last week above descending wedge/downtrend resistance (on the weekly chart from April to June)…
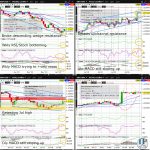
The GBPUSD is once again in the early stages of trying to form a major bottom with this week’s green weekly candle trying to push above last week’s high. Any daily close above descending wedge resistance (on the daily chart) will likely coincide with a test of the weekly chart descending wedge resistance…