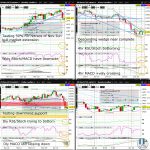
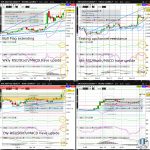
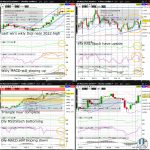
Corn (ZC) slid another 1% Friday adding to the steep losses since breaking upchannel support (on the weekly chart) 2 weeks ago. ZC is beginning to appear it may have overshot to the downside with Thursday’s break below downtrend support (on the daily chart)…
Tag: Corn
Soybean (ZS) Testing 50% Fib Retrace of Nov-Jun Bull Market Extension
Register/Login to freely access technical analysis on the market described in the headline above. Today’s Top 3 Trades includes technical analysis on: Agris (Soybean | Corn) + Today’s Top Trade (GBPAUD) Join the world’s largest asset manager and 2 of the world’s 5 largest (and 5 of the 10 largest) hedge funds by AUM asRead More
Soybean (ZS) Weekly MACD Negatively Crossing
Soybean (ZS) is showing exhaustion after selling off last week following a fresh 2022 high the week prior. Any break below descending triangle support (on the 4hr chart) will likely coincide with a slide below ascending triangle support (on the weekly chart)…
Wheat (ZW) Tries Forming Higher June Low VS Mar Low
Wheat (ZW) is trying to firm after Friday’s WASDE, but remains vulnerable to a deeper consolidation in June. The monthly red hammer trying to form (as can be seen on tradingview.com) after 3 green monthly candles with long upper shadows suggests a moderately high probability for a retest in June of the psychologically key 1000 whole figure level and the 50% Fib retrace of the January to March bull market extension…
Wheat Retesting Weekly Chart Upchannel Support Ahead of WASDE
Wheat (ZW) is trying to firm after a 3 week slide from the 2022 high, but remains vulnerable to retesting the psychologically key 1000 whole figure level and the 50% Fib retrace of the January to March bull market extension. Nevertheless, any break above downchannel resistance (on the 4hr chart) would dramatically increase the odds for a sustainable bounce off upchannel support (on the weekly chart)…
Wheat (ZW) Weekly Chart Bull Flag Extends on WASDE
Wheat (ZW)’s massive 5% or so gap up to start the week has further extended the Bull Flag (on the weekly chart), with ZW nearing the 2022 high. Nevertheless, with a Doji forming on the 4hr, daily and weekly chart, ZW is unlikely to have much further upside this week…
Wheat (ZW) Weekly Chart Bull Flag Consolidation Near Complete
Wheat (ZW)’s Bull Flag consolidation (or daily chart triangle) since early March is in its advanced stages, with ZW nearing the April high. Any break above the daily chart triangle resistance and April high will likely have to wait until after the highly anticipated May 12th WASDE release…
Wheat (ZW) Reclaims 50% Fib Retrace of War Surge
Wheat (ZW) rallied in today’s Asia morning to start the week, halting the month plus slide from the 2022 high. Significantly, ZW has reclaimed the 50% Fib retrace of the war surge after strongly bouncing off from the psychologically key 1000 whole figure level…
Wheat (ZW) Nearing 50% Fib Retrace of War Surge
Wheat (ZW) is sliding towards the low end of the roughly 3 week consolidation to start the week. Significantly, ZW appears vulnerable before month end to a test of the 50% Fib retrace of the February to March rally extension, with a moderate probability of testing the psychologically key 1000 whole figure level during the same period…
Soybean (ZS) Daily Chart Triangle Near Complete
Soybean (ZS) is pushing higher to start the week, nearing completion on the daily chart triangle. Significantly, with a green weekly Doji beginning to form, ZS appears unwilling to deepen in its 2 week plus consolidation, improving odds for ZS to gravitate before month end, back to its 2022 high (from February)…