Wheat (ZW) Nearing Weekly Chart Descending Wedge Support

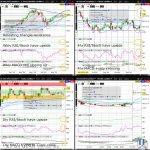
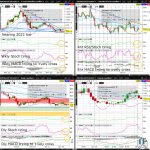
Wheat (ZW) is starting the week continuing a consolidation near the 2022 low, remaining vulnerable to a deeper slide towards descending wedge support (on the weekly chart) in January. With ZW below the 61.8% Fib retrace of the September 2016 to March 2022 bull market (as can be seen on a monthly chart on tradingview.com), odds are moderate for a sliding back to the 2021 low just below the psychologically key 600 whole figure level sometime in Q1…

Wheat (ZW) Nearing 2022 Low Ahead of WASDE

Wheat (ZW) is starting the week consolidating for a 3rd straight day near the 2022 low, remaining vulnerable to a deeper slide towards descending wedge support (on the weekly chart) in January. With ZW below the 61.8% Fib retrace of the September 2016 to March 2022 bull market (as can be seen on a monthly chart on tradingview.com), ZW is moderately vulnerable to sliding back to the 2021 low just below the psychologically key 600 whole figure level sometime in Q1….

Wheat (ZW) Consolidating Near 61.8% Fib Retrace of Sep16-Mar22 Bull Market

Wheat (ZW) has been consolidating for 2 weeks near the 61.8% Fib retrace of the September 2016 to March 2022 bull market (as can be seen on a monthly chart on tradingview.com), but remains moderately vulnerable to sliding back to the 2022 low before year end. ZW will need a weekly close above the psychologically key 800 whole figure level and to break above descending wedge resistance (on the weekly chart) to neutralize the still somewhat bearish longer term momentum…

Soybean (ZS) Weekly MACD Positively Crossing

Soybean (ZS) is consolidating to start the week, hesitating for roughly 2 weeks now just below triangle resistance (on the weekly chart) and near the 50% Fib retrace of the slide from the June high to the July low. Odds are better for a retest of the 2022 high going into year end, than it is for a slide back to the July low during the same period, with the July low coinciding with the 50% Fib retrace of the May 2019 to June 2022 bull market (as can be seen on tradingview.com)…

Soybean (ZS) Retests Weekly Chart Triangle Resistance Ahead of WASDE

Soybean (ZS) is forming a daily and weekly Doji to start the week, hesitating after last week’s strong surge to triangle resistance (on the weekly chart). With ZS having reversed more than half of the sharp slide from the June high to the July low, odds are better for a retest of the 2022 high going into year end, than it is for a slide back to the July low during the same period, with the July low coinciding with the 50% Fib retrace of the May 2019 to June 2022 bull market (as can be seen on tradingview.com)…

Corn (ZC) Retesting Weekly Chart Triangle Resistance

Corn (ZC) gapped up more than 2% to start the week, but is likely to consolidate these next few days as it bumps against the psychologically key 700 whole figure level and triangle resistance (on the weekly chart). With the rebound off upchannel support (on the weekly chart), odds are decent for a test of the same upchannel’s resistance, coinciding roughly with the 2022 high, before year end…

Corn (ZC) Retesting Weekly Chart Triangle Resistance

Corn (ZC) is pushing higher to start the week, but likely to hesitate in the next day or so as it bumps up against triangle resistance (on the weekly chart) and the psychologically key 700 whole figure level. Although healthy profittaking is in order, with ZC’s strong bounce off the July low, ZC appears more likely to retest the 2022 high before year end than to slide back in the same period to the July low, or the 50% Fib retrace of the April 2020 to April 2022 bull market (as can be seen on tradingview.com)…