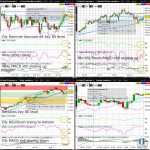
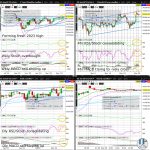
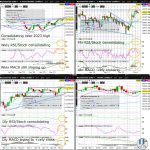
Nasdaq100 (NQ) Testing Weekly Chart Ascending Wedge Support

Nasdaq100 (NQ) slid more than 0.5% lower Friday, closing the week near its low. NQ increasingly appears close to completing its massive rally from the 2022 low (in October) to the 2023 high (formed in July) with NQ testing ascending wedge support (on the weekly chart). If the August candle (as can be seen more easily on a monthly chart on tradingview.com) elongates in its red body to below the June low, the July high will likely have marked the high for 2023…

S&P500 (ES) Edges To New 2023 High

The S&P500 (ES) is consolidating after edging higher yesterday to a fresh 2023 high above triangle resistance (on the weekly chart). ES increasingly appears ready to join the Nasdaq100 (NQ) in gravitating to the 61.8% Fib retrace of the slide from the January 2022 high to October 2022 low (as can be seen more easily on a weekly chart on tradingview.com)…

S&P500 (ES) Continues Consolidating Just Below 2023 High

The S&P500 (ES) is consolidating for a second straight day after Friday’s bounce to near the 2023 high, hovering just under the 50% Fib retrace of the slide from the January 2022 high to October 2022 low (as can be seen more easily on a weekly chart on tradingview.com). Any break this week above the April high will suggest an extension of the bounce off the October low to a fresh 2023 high…