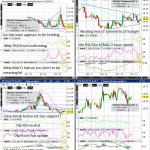
Euro Philadelphia Index Weekly The Euro index continues forming its tradable bottom, with the weekly MACD about to positively crossover finally, and a positive divergence seen between the weekly RSI, Stochastics and price. Longer term, one can spot potential downside risk to 119-120, especially within the context of a monthly chart. Let’s view the EURUSDRead More
Tag: GC_F
EURUSD Edging Closer to Tradable Bottom
VIX (CFE VX Dec14) Weekly/Daily/4hr/Hourly The VX saw another day of mild downside pressure yesterday, but as with yesterday, has begun rebounding in today’s Asian session. The key July-September support zone (of 15-16 with the December contract) continues holding, and the VIX is now nearing the end of a symmetrical triangle as seen on theRead More
EURUSD, AUDUSD, GBPUSD Consolidating Rally off Bottom
Euro Philadelphia Index Weekly The Euro index surged higher yesterday, and as can be seen in the weekly chart below, has 130 in its crosshairs. Before hitting this next key target, consolidation today is in order after the bounce from 125. Refer to the shorter timeframe EURUSD charts below for a clearer picture of thisRead More
Commodities at Various Stages of Consolidation Before Resuming Rally
Raw Sugar (ICE SB Mar15) Weekly/Daily/4hr/Hourly SB has completed its basing these last few sessions following a pullback late last week, and is now resuming its march higher. On the daily chart, SB appears to want to target the upchannel resistance at roughly .175. On the 4hr chart, the ascending wedge drawn suggests upside mayRead More
Wheat (ZW)’s Weekly/Daily/4hr Charts Aligning
Wheat (CME ZW Dec14) Weekly/Daily/4hr/Hourly ZW rallied ahead of the WASDE report last Friday, and only pulled back marginally following the release. It continues consolidating the Friday gains in the Asian session, and appears set to resume upside shortly. ZW is just about to break above the descending wedge resistance line (as seen in theRead More
Pending Volatility Spike on Corn (ZC), Wheat (ZW), Soybeans (ZS) Post-Wasde
Cotton (ICE CT Dec14) Weekly/Daily/4hr/Hourly CT continued selling off yesterday after hitting a key resistance level (former ascending triangle support as seen in the daily chart), but found support at the 50% Fibonacci retracement of the rally from .61 to .653 (as seen in the 4hr chart). Its weekly and daily RSI, Stochastics and MACD,Read More
Gold (GC), Silver (SI) Weekly/Daily/4hr Charts Bullishly Align
Gold (CME GC Dec14) Weekly/Daily/4hr/Hourly GC has made a nice bounce this week off of downchannel support (as seen in the daily chart) and is now at the same channel’s resistance. On the weekly chart, you can also see GC having successfully bounced off of major support from its Dec/Jan lows. Bullishly, the weekly, dailyRead More