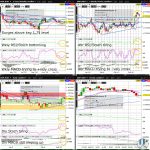
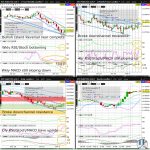
The S&P500 (ES) is trying to firm going into the weekend, but remains wobbly for next week as it has arguably slid back into the downchannel (on the weekly chart). Odds are low for a fresh February high before month end, with ES more likely to slide to a new February low in the same period…
Tag: ES_F
GBPAUD Weekly MACD Trying to Positively Cross
The GBPAUD is consolidating after the massive 350 pip or so gain from the Tuesday low to yesterday’s high, with decent odds now of testing the psychologically key 1.80 whole figure level and the 50% Fib retrace of the February to September slide by early March. Although the GBPAUD has halted the slide since the December high, it remains within a major downchannel since March 2020 (as can be seen easier on a monthly chart on tradingview.com)…
S&P500 (ES) Retesting Weekly Chart Downchannel Resistance
The S&P500 (ES) is looking wobbly as it has arguably slid under an uptrend support (on the daily chart). Odds are fairly low for a fresh February high before month end, with ES appearing like it will slide back into the downchannel (on the weekly chart) by mid week…
VIX (VX) Rebounds Off Key 20 Level Just Above 2023 Low
The VIX (VX) bounced more than 5% yesterday off the psychologically key 20 whole figure level. The VX has now reversed half of the Monday to Wednesday slide and appears poised to retest by early next week, downchannel resistance (on the weekly chart)…
S&P500 (ES) Nears Aug High Ahead of CPI
The S&P500 (ES) is consolidating after yesterday’s 1% plus gains, testing triangle resistance (on the 4hr chart). Any surge to a fresh February high this week will dramatically increase the odds that the 2022 bear has ended…
VIX (VX) Weekly Chart Bullish Island Reversal Near Complete
The VIX (VX) is consolidating yesterday’s break above downchannel resistance (on the 4hr and daily chart), and appears poised to complete a Bullish Island Reversal (on the weekly chart). With the bounce off downchannel support (on the weekly chart) gaining momentum, a weekly close above the psychologically key 20 whole figure level is all but assured…
USDCAD Weekly Chart Triangle Near Complete
The USDCAD continues consolidating but should be seeing a volatility surge soon as the triangle (on the weekly chart) nears completion. Before bulls get excited, they’ll want to see the USDCAD close on a weekly basis above the weekly chart triangle resistance and the psychologically key 1.35 whole figure level…
S&P500 (ES) Consolidates Just Above Weekly Chart Downchannel Resistance
The S&P500 (ES) is trying to firm, but remains vulnerable this week to a deepening in the consolidation that began Friday. Although the February high formed Thursday has been slightly higher than the January and December highs, a slide back (this week) below the psychologically key 4k whole figure level and the uptrend support (on the weekly chart) connecting the October and December lows would keep alive the possibility (albeit moderately unlikely for now) that the break above the weekly chart downchannel resistance was a Bear Trap…
VIX (VX) Weekly Doji Just Below Key 20 Level Ahead of NFP
The VIX (VX) is trying to halt the slide from October by rebounding off yesterday’s fresh 2023 low. Before bulls get excited, the VX will need a daily close above downchannel resistance (on the daily chart)…
S&P500 (ES) Testing Weekly Chart Downchannel Resistance
The S&P500 (ES) is consolidating after the strong reversal off the Wednesday Hammer low, hesitating as it bumps against downchannel resistance (on the weekly chart). Although odds are elevated for a weekly close above this key bear-bull battle ground, a break above the weekly chart downchannel resistance could very well be brief with the highly anticipated FOMC and Fed rate announcement Wednesday potentially setting up for a slide back into the same downchannel…