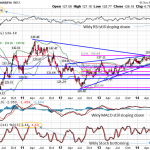
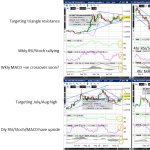
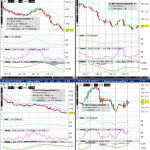
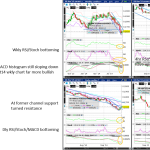
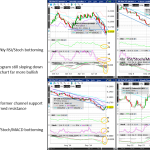
Gold (CME GC Dec14) Weekly/Daily/4hr/Hourly GC has made a nice bounce this week off of downchannel support (as seen in the daily chart) and is now at the same channel’s resistance. On the weekly chart, you can also see GC having successfully bounced off of major support from its Dec/Jan lows. Bullishly, the weekly, dailyRead More
Commodities Taking Breather Before Resuming Upside
Cotton (ICE CT Dec14) Weekly/Daily/4hr/Hourly CT pushed further up yesterday, but may tire today following signficant gains over the last few sessions. It now sits near the middle of a channel just under an ascending support turned resistance line (as seen in the daily chart). Although CT’s weekly RSI, Stochastics and MACD are all turningRead More
Commodity Laggards Silver (SI), Gold (GC) Bottoming
Although I feel silver (CME SI Dec14) and gold (CME GC Dec14) are bottoming, I haven’t profiled their charts in today’s list as I still feel their trade setups offer slightly less favourable risk:reward versus my trade ideas presented below. As usual, I try listing as many tradable setups (which I consider trading during theRead More
Corn (ZC), Wheat (ZW) Weekly/Daily/4hr Charts Bullishly Aligning
Corn (CME ZC Dec14) Weekly/Daily/4hr/Hourly ZC is at the end of a descending wedge now (see weekly chart), and its weekly, daily and 4hr RSI, Stochastics and MACD are all sloping up and pointing bullishly. On the 4hr chart, ZC has broken above a descending channel resistance line, and next resistance is only slightly aboveRead More
Cotton (CT) Ready to Rebound
Cotton (ICE CT Dec14) Weekly/Daily/4hr/Hourly CT saw a bit of hestitation yesterday after Wednesday’s minor bounce, giving up most of the prior day’s gains. The pullback has been shortlived though, as at the time of this writing (early in the Asian session), CT is moving up again and continues exhibiting bottoming characteristics on its weeklyRead More
EURUSD Bottoming, USDJPY Topping
Euro Philadelphia Index Weekly The Euro index can be seen probing a major horizontal support line as seen in my weekly chart below. I originally drew this support line slightly higher (as seen in the chart images used for the Euro index in the last few days), so it appeared as if major support wasRead More
Arabica Coffee (KC) Upward Momentum Increasing
Arabica Coffee (ICE KC Dec14) Weekly/Daily/4hr/Hourly KC added to its rally yesterday, and still looks bullish on its weekly RSI and Stochastics, fueling its march towards triangle resistance (as seen on the weekly chart). Although the daily Stochastics is showing initial signs of tiring, with the weekly MACD not quite having crossed positively yet, IRead More
Corn (ZC), Wheat (ZW) Poised to Rebound
Corn (CME ZC Dec14) Weekly/Daily/4hr/Hourly ZC began clawing back recent losses yesterday, looking increasingly attractive given its extremely low weekly Slow Stochastics %K/%D values of 1.24 and 2.12 (obtained at the time of this writing from stockcharts.com’s 5yr weekly chart with Slow Stochastics of the $CORN symbol). It is also sitting under descending wedge supportRead More
VIX Making Higher Highs, Higher Lows
Raw Sugar (ICE SB Mar15) Weekly/Daily/4hr/Hourly SB had a strong performance last week and is now back into the downchannel that it had broken below a few weeks ago (as seen in the daily chart). After the incredible rally last week, the weekly RSI and Slow Stochastics are turning up nicely, with the weekly MACDRead More
Commodities Putting in a Short-Term Bottom
Raw Sugar (ICE SB Mar15) Weekly/Daily/4hr/Hourly SB has just completed a double bottom with its 2010 low at .13 (on the spot price chart posted yesterday). The double bottom has coincided with an increasingly narrowing descending wedge’s support line. The weekly RSI, MACD and Slow Stochastics are all turning up now. As mentioned yesterday, theRead More