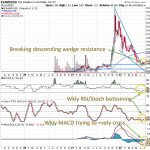
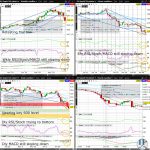
Corn (ZC) has gapped up 4% plus to start the week, and is suddenly testing the 38.2% Fib retrace of the May to July slide. With last week’s green weekly Hammer and ZC trying to reclaim downchannel support (on the daily chart), ZC appears to have halted the slide from the May peak.
Month: July 2022
Sandbox (SAND) Bounces Off Key 1 Level
TOP50’sTOP10 (SANDUSD, MANAUSD, ATOMUSD, MATICUSD, XTZUSD, DOTUSD, SOLUSD, BNBUSD, FTTUSD, AVAXUSD)
Raw Sugar (SB) Testing Weekly Chart Descending Wedge Resistance
Raw Sugar (SB) is making progress in halting the correction since the May peak, closing yesterday at downchannel resistance (on the 4hr and daily chart). Any weekly close above the descending wedge resistance (on the weekly chart) will dramatically increase odds for a retest of the psychologically key 0.20 whole figure level in July sometime…
USDCAD Retesting Key 1.3 Level, 2022 High
The USDCAD is consolidating a second straight day after Tuesday’s surge to just above the psychologically key 1.30 whole figure level and 2022 high. Odds are elevated that the USDCAD will sometime in July, extend its Bull market to the November 2020 high, which happens to be the 50% Fib retrace of the March 2020 to May 2021 slide (as can be seen on tradingview.com)…
WTI Crude (CL) Tests Key 100 Level Ahead of Inventory
WTI Crude (CL) is consolidating after yesterday’s massive 8% plus slide to below ascending wedge support (on the weekly chart). CL is suddenly testing the psychologically key 100 whole figure level, remaining vulnerable to more downside today after breaking yesterday below triangle support (on the daily chart)…
S&P500 (ES) Nearing 3 Month Downtrend Resistance
The S&P500 (ES) is making progress in its effort at forming a multi-month low. Any break above triangle resistance (on the 4hr chart) will likely coincide with a test of the descending wedge/downtrend resistance (on the weekly chart from April to June)…
Corn (ZC) Nearing Key 600 Level
Corn (ZC) slid another 1% Friday adding to the steep losses since breaking upchannel support (on the weekly chart) 2 weeks ago. ZC is beginning to appear it may have overshot to the downside with Thursday’s break below downtrend support (on the daily chart)…
Sandbox (SAND) Weekly MACD Trying to Positively Cross
TOP50’sTOP10 (SANDUSD, XTZUSD, MANAUSD, DOTUSD, MATICUSD, ATOMUSD, SOLUSD, FTTUSD, CROUSD, AVAXUSD)
Arabica Coffee (KC) Retests 50% Fib Retrace of February-May Pullback
Arabica Coffee (KC) gained a near 1% yesterday, further reclaiming upchannel support (on the daily and weekly chart). With KC just shy of downchannel resistance (on the 4hr chart) and comfortably above the psychologically key 2.25 whole figure level, KC no longer appears likely to slide back to the May low in July…