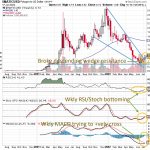
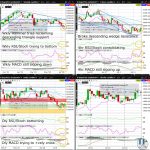
Soybean (ZS) is trying to halt its slide from the June peak, but remains vulnerable this week to completing the 4hr chart triangle to the downside effectively continuing a Bear flag or downchannel (on the daily chart). Nevertheless, bears should not rule out short covering with ZS trying to bounce off the 61.8% Fib retrace of the November to June bull market extension…
Month: July 2022
Coffee Daily Jul 18, 2022
Robusta Coffee (RC) edged lower Friday, closing near a fresh July and 2022 low. With 6 straight red weekly candles, odds are rising for a short covering bounce by early this week…
Polygon (MATICUSD) Breaks Weekly Chart Descending Wedge Resistance
TOP50’sTOP10 (MATICUSD, SANDUSD, ATOMUSD, XTZUSD, BNBUSD, ETHUSD, FTTUSD, BTCUSD, MANAUSD, SOLUSD)
Raw Sugar (SB) Weekly MACD Green Line Flattening
Raw Sugar (SB) has spent most of this week consolidating last week’s strong bounce as seen by the near complete weekly Doji. Odds appear decent for an extension of last week’s gains sometime next week…
Coffee Daily Jul 15, 2022
Robusta Coffee (RC) slid more than 2.5% yesterday, closing at a fresh July and 2022 low. With RC on pace for its 6th straight red weekly candle, odds are rising for a short covering bounce by early next week…
Coffee Daily Jul 14, 2022
Robusta Coffee (RC) bounced more than 1% yesterday, forming a weekly Hammer after bouncing off the 2022 low freshly formed Friday. Yesterday’s break above descending wedge resistance (on the 4hr chart) dramatically increases the likelihood of the 1st green weekly candle in 6 weeks…
USDCAD Daily MACD Trying to Positively Cross
The USDCAD is in the advanced stages of consolidating near the psychologically key 1.30 whole figure level and 2022 high. Odds are elevated that the USDCAD will sometime in July, extend its Bull market to the November 2020 high, which happens to be the 50% Fib retrace of the March 2020 to May 2021 slide (as can be seen on tradingview.com)…
Coffee Daily Jul 13, 2022
Robusta Coffee (RC) slid more than 0.5% yesterday closing near its 2022 low formed Friday. RC will need to break above descending wedge resistance (on the 4hr chart) in the next day or so to halt the 6 straight red weekly candles…
WTI Crude (CL) Nearing 50% Fib Retrace of Dec-Jun Bull Market Extension
WTI Crude (CL) slid a massive near 8% yesterday, closing near the July and May lows. With yesterday’s inability to recapture prior ascending wedge support (on the weekly chart) and the subsequent fall below the psychologically key 100 whole figure level, CL appears to want to test in July, the 50% Fib retrace of the December to June bull market extension…
Nasdaq100 (NQ) Weekly MACD Trying to Positively Cross
The Nasdaq100 (NQ) is tiring in its Dead Cat Bounce, but appears to still have a few months to go before the downchannel (on the weekly chart) is ready to resume. Key in the next day or so will be whether NQ can bounce off upchannel support (on the 4hr chart) which would coincide with a break above downchannel resistance (on the daily chart) and the psychologically key 12k whole figure level…