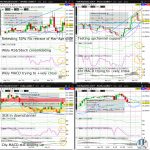
Wheat (ZW) is trying to firm after Friday’s WASDE, but remains vulnerable to a deeper consolidation in June. The monthly red hammer trying to form (as can be seen on tradingview.com) after 3 green monthly candles with long upper shadows suggests a moderately high probability for a retest in June of the psychologically key 1000 whole figure level and the 50% Fib retrace of the January to March bull market extension…
Tag: ZW_F
Wheat Retesting Weekly Chart Upchannel Support Ahead of WASDE
Wheat (ZW) is trying to firm after a 3 week slide from the 2022 high, but remains vulnerable to retesting the psychologically key 1000 whole figure level and the 50% Fib retrace of the January to March bull market extension. Nevertheless, any break above downchannel resistance (on the 4hr chart) would dramatically increase the odds for a sustainable bounce off upchannel support (on the weekly chart)…
Soybean (ZS) Retesting Weekly Chart Ascending Triangle Resistance
Soybean (ZS) is hesitating as it retests ascending triangle resistance (on the weekly chart). When ZS reopens after a shortened holiday session, ZS could briefly burst to a fresh 2022 high, although healthy profittaking will likely kick in by mid week given that ZS is nearing upchannel resistance (on the 4hr chart)…
Soybean (ZS) Consolidating Just Below 2022 High
Soybean (ZS) is hesitating to start the week, and appears ready to consolidate the strong gains over the past 2 weeks. Nevertheless, with the ascending triangle (on the weekly chart) in its advanced stages, any break to a fresh 2022 high will dramatically increase the likelihood of a retest of the 2012 record high in the week after…
Wheat (ZW) Weekly Chart Bull Flag Extends on WASDE
Wheat (ZW)’s massive 5% or so gap up to start the week has further extended the Bull Flag (on the weekly chart), with ZW nearing the 2022 high. Nevertheless, with a Doji forming on the 4hr, daily and weekly chart, ZW is unlikely to have much further upside this week…
GBPAUD Weekly MACD Trying to Positively Cross
Register/Login to freely access technical analysis on the market described in the headline above. Today’s Top 3 Trades includes technical analysis on: FX (GBPAUD | EURUSD) + Today’s Top Trade (Wheat) Join the world’s largest asset manager and 2 of the world’s 5 largest (and 5 of the 10 largest) hedge funds by AUM asRead More
Wheat (ZW) Weekly Chart Bull Flag Consolidation Near Complete
Wheat (ZW)’s Bull Flag consolidation (or daily chart triangle) since early March is in its advanced stages, with ZW nearing the April high. Any break above the daily chart triangle resistance and April high will likely have to wait until after the highly anticipated May 12th WASDE release…
Wheat (ZW) Nearing Key 1000 level
Wheat (ZW)’s Bull Flag consolidation (or daily chart triangle) since early March is once again deepening, with ZW nearing the April low. Nevertheless, any strong bounce off downchannel support (on the 4hr chart) will likely coincide with a break above the daily chart triangle resistance…
USDCAD Weekly MACD Positively Crossing
The USDCAD is trying to complete a 5th straight green weekly candle, and appears to want to test the 2022 high and psychologically key 1.30 whole figure level by early May. A monthly close above 1.30 would signal the completion of a major bottoming effort since June 2021 (seen more easily on a monthly chart at tradingview.com)…
VIX (VX) Retraces Half of Mar-Apr Slide
The VIX (VX) is gearing up for a retest of yesterday’s high to near the psychologically key 30 whole figure. Any daily close above downchannel resistance (on the daily chart) will dramatically increase the odds of testing the 2022 high in May…