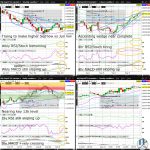
The GBPAUD is nearly complete in an ascending triangle (on the 4hr and daily chart), but appears in need of a breather before gravitating going into month end to the psychologically key 1.80 whole figure level. With the GBPAUD having reclaimed the 50% Fib retrace of the February to September slide, odds are suddenly moderate for a retest of the 2022 high by year end…
Tag: ES_F
S&P500 (ES) Tries Holding Last Week’s 2022 Low
The S&P500 (ES) is trying to hold last week’s fresh 2022 low after having given up all of last week’s first half gains. Although ES appears vulnerable to following the Nasdaq100 (NQ) in forming a fresh 2022 low, odds are rising for a multi-week bounce, where any break above downtrend resistance (on the daily chart) will dramatically increase the likelihood for a retest of the psychologically key 4k whole figure level sometime before month end…
S&P500 (ES) Attempts Another Dead Cat Bounce From Fresh 2022 Low
The S&P500 (ES) is bumping up against downchannel resistance (on the 4hr chart) but appears poised to surge higher as it has just broken what is arguably a descending wedge resistance (on the daily chart). ES is poised to extend the rebound off its fresh 2022 low formed yesterday, as it has now clawed back above the prior 2022 low (of June), and appears to be gearing up for another Dead Cat Bounce (but weaker in magnitude) relative to the late June-late August one…
Nasdaq100 (NQ) Nearing 2022 Low Ahead of Powell’s Comments
Nasdaq100 (NQ) is trying to firm and bounce off downchannel support (on the daily chart) but remains vulnerable to testing the 2022 low before the weekend. Regardless of any bounce off the June low or the psychologically key 11k whole figure level going into next week, NQ appears ready to extend its weekly chart downchannel in October…
Nasdaq100 (NQ) Daily MACD Positively Crossing
Nasdaq100 (NQ) is slowing in its bounce off last week’s low, hesitating as what is arguably an ascending wedge (on the 4hr chart) nears completion. Nevertheless, NQ appears poised to at least test downtrend resistance (on the weekly chart) this week, where any recapture of the August high this month will likely extend the Dead Cat Bounce that began in June into October…
Nasdaq100 (NQ) Trying to Halt Slide Back to 2022 Low
Nasdaq100 (NQ) is trying to halt its slide back towards its 2022 low, with bulls likely to get reprieve this week as most US traders return from the US Labour Day long weekend. NQ is poised to break above downchannel resistance (on the 4hr chart) and claw back above upchannel support (on the daily chart)…
Nasdaq100 (NQ) Nearing 50% Fib Retrace of Jan-Jun Slide
The Nasdaq100 (NQ) is beginning to form a weekly Hammer, but appears to be gravitating in its Dead Cat Bounce to the 50% Fib retrace of the January to June slide. With NQ above downtrend resistance (on the weekly chart), a further short squeeze before month end to the 61.8% Fib retrace of the January to June slide should not be ruled out…
Nasdaq100 (NQ) Weekly Gravestone @ 38.2% Fib Retrace of Jan-Jun Slide
The Nasdaq100 (NQ) is forming a weekly Gravestone, tiring in its Dead Cat Bounce near the 38.2% Fib retrace of the January to June slide. Although NQ is at moderate risk of getting rejected this week at downtrend resistance (on the weekly chart), odds are roughly equal for a further short squeeze in August to the 50% Fib retrace of the January to June slide…
S&P500 (ES) Tiring Just Above 38.2% Fib Retrace of Jan-Jun Slide
The S&P500 (ES) is hesitating in its month plus Dead Cat bounce to just above the 38.2% Fib retrace of the January to June slide. Yesterday’s break above downchannel resistance (on the weekly chart from April to July) has been weak, with decent odds for a slide back this week to the psychologically key 4k whole figure level…
S&P500 (ES) Weekly MACD Trying To Positively Cross
The S&P500 (ES) is hesitating in its effort at forming a multi-month low after arguably forming a second data point on a triangle resistance (on the daily chart). Nevertheless, ES appears to be merely consolidating its break last week above descending wedge/downtrend resistance (on the weekly chart from April to June)…