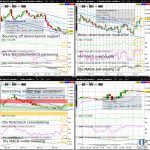
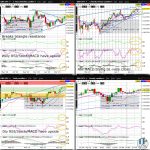
The USDJPY is forming a daily Doji at what appears to be triangle resistance (on the daily chart), hesitating as it bumps against upchannel resistance (on the 4hr chart). Nevertheless, with the USDJPY arguably having broken this week above triangle resistance (on the weekly chart), odds are decent for a weekly close above the psychologically key 135 whole figure level…
Category: Today’s Top 3 Trades
Natural Gas (NG) Bounces Off Weekly Chart Downchannel Support
Natural Gas (NG) is consolidating after decisively reclaiming the psychologically key 2 whole figure level after briefly falling beneath it last week. With NG having successfully bounced yesterday off just above downchannel resistance (on the 4hr chart), NG is gaining momentum on its rebound off last week’s 2023 low and downchannel support (on the weekly chart)…
S&P500 (ES) Testing 50% Fib Retrace of Jan’22-Oct’22 Slide
The S&P500 (ES) is consolidating near a fresh April high, hesitating as it tests the 50% Fib retrace of the slide from the January 2022 high to October 2022 low (as can be seen more easily on a weekly chart on tradingview.com), and nears the 2023 high formed February. Further creating caution is ES bumping up against a downtrend resistance (on the weekly chart)…
Corn (ZC) Testing Weekly Chart Triangle Resistance
Corn (ZC) is testing symmetrical triangle resistance (on the weekly chart), with decent odds for reclaiming the 2023 high in April. Any break above ascending triangle resistance (on the 4hr chart) this week will dramatically reduce the likelihood of ZC sliding back before month end to triangle support (on the weekly chart)…
S&P500 (ES) Weekly Hammer Nears 2023 High
The S&P500 (ES) is consolidating just shy of the April and February high, forming a weekly Hammer just below downtrend resistance (on the weekly chart). ES now appears more likely to test the August high in April than the psychologically key 4k whole figure level…
GBPJPY Breaks Weekly Chart Triangle Resistance
The GBPJPY is forming a daily Doji after yesterday’s daily Hammer/Doji, catching its breath after a rally extension from last week’s low. Odds are decent for a test of the December high in April after decisively breaking this week above triangle resistance (on the weekly chart)…
Gold (GC) Poised to Retest 2023 High
Gold (GC) is consolidating near ascending triangle resistance (on the 4hr and daily chart), and appears to be gearing up to retest upchannel resistance (on the weekly chart) ahead of the weekend. With GC having recovered from a brief dip Monday below the psychologically key 2000 whole figure level, odds are elevated for GC to before month end, form a fresh 2023 high and complete a Bull Flag consolidation since August 2020 (as can be seen more easily on a monthly chart on tradingview.com)…
VIX (VX) Weekly Doji @ Fresh 2023 Low
The VIX (VX) is trying to firm after sliding yesterday to a fresh 2023 low below the psychologically key 20 whole figure level. Nevertheless, with the VX arguably nearing descending wedge completion (on the 4hr and daily chart), the VX appears more likely to retest the March high in April than to slide all the way to downchannel support (on the weekly chart) in the same period…
Soybean (ZS) Consolidates Near Key 1500 Level Ahead of WASDE
Soybean (ZS) is trying to firm to start the week following Thursday’s 1% plus slide going into the Easter holiday long weekend. ZS is now back below the psychologically key 1500 whole figure level, but appears more likely to retest the 2023 high within a day following the highly anticipated WASDE Tuesday than it is to retest the 2023 low…
GBPAUD Weekly Chart Bull Flag Extends to Fresh 2023 High
The GBPAUD is extending an upchannel (on the 4hr and daily chart), appearing to have a bit more upside going into the weekend before its weekly chart Bull Flag begins consolidating again. With the GBPAUD having formed a fresh 2023 high yesterday, any healthy profittaking going into next week will likely find initial support at the psychologically key 1.85 whole figure level…