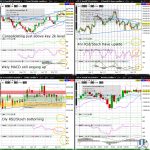
VIX (VX) Tests 2023 Low Ahead of US Retail Sales

The VIX (VX) is testing the 2023 low formed early May, with any further downside today dramatically increasing the odds of testing the daily chart downchannel support in the week after. Nevertheless, the VX is arguably in the advanced stages of a descending wedge (on the 4hr chart), with a short covering this week back to downchannel resistance (on the daily chart) and the psychologically key 20 whole figure level moderately likely…

USDCAD Weekly Chart Triangle Since October Near Complete

The USDCAD is consolidating after the strong gains of the past 2 weeks, but appears to have upside momentum to gravitate to triangle resistance (on the weekly chart) by early May sometime. With the USDCAD comfortably back above the psychologically key 1.35 whole figure level, the USDCAD is arguably in the advanced stages of the weekly chart triangle which is arguably a Bull Flag consolidation (as can be seen easier on a monthly chart on tradingview.com)…

VIX (VX) Weekly Doji @ Fresh 2023 Low

The VIX (VX) is trying to firm after sliding yesterday to a fresh 2023 low below the psychologically key 20 whole figure level. Nevertheless, with the VX arguably nearing descending wedge completion (on the 4hr and daily chart), the VX appears more likely to retest the March high in April than to slide all the way to downchannel support (on the weekly chart) in the same period…