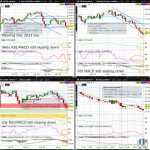
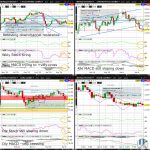
Sugar Daily Apr 19, 2024

Raw sugar (SB) edged higher with a daily Doji yesterday for its 1st green daily candle in 10 days. Despite yesterday’s bounce off Wednesday’s fresh 2024 low and the lowest level since January 2023, SB has decisively broken the upchannel support connecting the lows of 2020 and 2023 as can be seen on a monthly continuous chart on tradingview.com with odds elevated for a test of the 50% Fib retrace of the April 2020 to March 2023 bull market top by month end…

Sugar Daily Apr 18, 2024

Raw sugar (SB) slid another 1% plus yesterday for its 9th straight red daily candle. With yesterday’s fresh 2024 low at the lowest level since January 2023, SB has decisively broken the upchannel support connecting the lows of 2020 and 2023 as can be seen on a monthly continuous chart on tradingview.com…

Sugar Daily Apr 15, 2024

Raw sugar (SB) slid more than 6 straight days Friday, closing around the 2024 low after briefly breaking below it intraday. SB has broken the upchannel support connecting the lows of 2020 and 2023 as can be seen on a monthly continuous chart on tradingview.com, with odds elevated for a fresh 2024 daily closing low this week…

Sugar Daily Apr 12, 2024

Raw sugar (SB) slid more than 2.5% lower yesterday, closing just shy of the March low. With SB back below prior downchannel resistance (on the weekly chart), and arguably breaking the upchannel support connecting the lows of 2020 and 2023 as can be seen on a monthly continuous chart on tradingview.com, odds are elevated for SB to form a fresh 2024 low in April…

Sugar Daily Apr 11, 2024

Raw sugar (SB) edged lower yesterday after getting rejected at prior upchannel support (on the 4hr chart). With SB back to prior downchannel resistance (on the weekly chart), odds are elevated for a breaking by next week sometime of the upchannel support connecting the lows of 2020 and 2023 as can be seen on a monthly continuous chart on tradingview.com…

Sugar Daily Apr 10, 2024

Raw sugar (SB) edged lower yesterday with a red daily Doji, closing below upchannel support (on the 4hr chart). With SB back to prior downchannel resistance (on the weekly chart), odds are elevated for a breaking by next week sometime of the upchannel support connecting the lows of 2020 and 2023 as can be seen on a monthly continuous chart on tradingview.com…