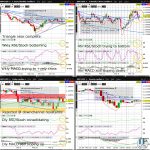
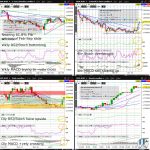
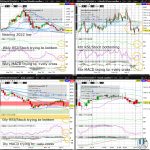
S&P500 (ES) Weekly Doji @ 50% Fib Retrace of Oct-Feb Bounce

The S&P500 (ES) is trying to form a weekly Doji after rebounding off near the 2023 low and the 61.8% Fib retrace of the October to February bounce. Although odds are now moderate for this week’s short covering to spring ES back to the psychologically key 4k whole figure level, ES is less likely to retest the weekly chart downchannel resistance before month end than it is to slide below the November low in the same period…

Wheat (ZW) Tries Bouncing Off Weekly Chart Descending Wedge Support

Wheat (ZW) is consolidating Friday’s bounce off a fresh 2023 low and descending wedge support (on the weekly chart) to start the week. Any break above the 4hr chart downchannel resistance in the next day or so would coincide with decisive gains above descending wedge resistance (on the daily chart), and dramatically increase odds of a test of the psychologically key 700 whole figure level in the day or so after…

Wheat (ZW) Nearing 2022 Low Ahead of WASDE

Wheat (ZW) is starting the week consolidating for a 3rd straight day near the 2022 low, remaining vulnerable to a deeper slide towards descending wedge support (on the weekly chart) in January. With ZW below the 61.8% Fib retrace of the September 2016 to March 2022 bull market (as can be seen on a monthly chart on tradingview.com), ZW is moderately vulnerable to sliding back to the 2021 low just below the psychologically key 600 whole figure level sometime in Q1….