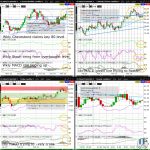
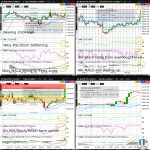
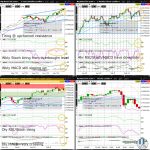
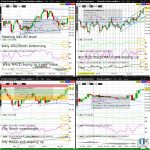
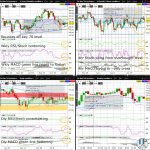
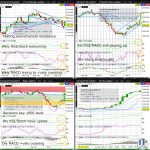
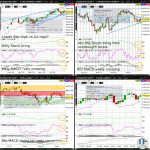
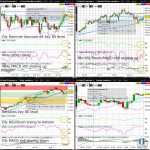
Gold (GC) surged more than 3% Friday, closing at downchannel resistance (on the weekly chart). With GC suddenly approaching the September high, odds are elevated for a test of the psychologically key 2000 whole figure level sometime this month…
The S&P500 (ES) formed a daily Doji Friday after Thursday’s daily Hammer, trying to halt the slide from the September high. Any break below ascending wedge support (on the weekly chart) sometime next week dramatically increases the likelihood of a lower September low versus the August low, and that the July high was the high for 2023…
Nasdaq100 (NQ) slid more than 0.5% lower Friday, closing the week near its low. NQ increasingly appears close to completing its massive rally from the 2022 low (in October) to the 2023 high (formed in July) with NQ testing ascending wedge support (on the weekly chart). If the August candle (as can be seen more easily on a monthly chart on tradingview.com) elongates in its red body to below the June low, the July high will likely have marked the high for 2023…
Wheat (ZW) slid a 3rd straight day Friday as part of the healthy consolidation after briefly breaking downchannel resistance (on the weekly chart) Tuesday. With last week’s weekly Gravestone closing just above the psychologically key 700 whole figure level, and a higher July high and low versus the June high and low, ZW will likely make progress in August with the major bottoming efforts off the 2023 low (formed at the end of May) and the weekly chart downchannel support…
WTI Crude (CL) consolidated Friday with a daily Hammer closing around the June high and just shy of the July high. With last week’s weekly Doji testing the psychologically key 75 whole figure level, odds are elevated for a retest before month end of the July high with a catalyst coming as early as Wednesday’s highly anticipated weekly US crude inventory…
The AUDUSD rebounded nearly 100 pips Friday from its intraday low to high, closing the week with a second straight weekly Hammer above the June low. The AUDUSD’s inability these past few weeks to slide back to triangle support (on the weekly chart) suggests decent odds for a retest of triangle resistance sometime in July…
WTI Crude (CL) is edging higher going into today’s 1030am EST highly anticipated weekly inventory and Thursday’s US unemployment claims. With CL bouncing yesterday off the psychologically key 70 whole figure level, odds are decent for a weekly close above downchannel resistance (on the weekly chart)…
The S&P500 (ES) is consolidating after edging higher yesterday to a fresh 2023 high above triangle resistance (on the weekly chart). ES increasingly appears ready to join the Nasdaq100 (NQ) in gravitating to the 61.8% Fib retrace of the slide from the January 2022 high to October 2022 low (as can be seen more easily on a weekly chart on tradingview.com)…
Register/Login to freely access technical analysis on the market described in the headline above. Today’s Top 3 Trades includes technical analysis on: Metals/Energy (Natural Gas | WTI Crude) + Today’s Top Trade (VIX) Join the world’s largest asset manager and 3 of the world’s 5 largest (and 5 of the 10 largest) hedge funds byRead More