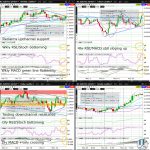
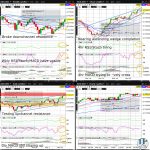
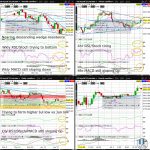
The S&P500 (ES) is making progress in its effort at forming a multi-month low. Any break above triangle resistance (on the 4hr chart) will likely coincide with a test of the descending wedge/downtrend resistance (on the weekly chart from April to June)…
Tag: AUDUSD
Arabica Coffee (KC) Reclaims Weekly Chart Upchannel Support
Arabica Coffee (KC) surged a massive 4% plus yesterday, closing at downchannel resistance (on the daily chart). Significantly, KC has reclaimed the weekly chart’s upchannel support and the psychologically key 2.25 whole figure level…
AUDUSD Bounces Off Just Above Key 0.70 Level
The AUDUSD surged roughly 100 pips yesterday on the back of the FOMC and US Fed rate hike, halting the correction from early April. Yesterday’s break above downchanel resistance (on the 4hr chart) dramatically increases odds for a break above descending wedge resistance (on the daily chart) by the weekend…
AUDUSD Retesting Weekly Chart Downchannel Resistance
The AUDUSD appears to have halted the correction from early April, finding support at prior downchannel resistance (on the weekly chart). Yesterday’s break above downchanel resistance (on the 4hr chart) gives a bullish bias to the triangle-like pattern (on the daily chart)…
Gold (GC) Nearing Weekly Chart Upchannel Support
Gold (GC) is tiring near upchannel support (on the weekly chart), putting at risk the rally extension since February. Any break of the daily chart triangle support will likely coincide with a test of the psychologically key 1900 whole figure level and the 50% Fib Retrace of August to March rally extension…
AUDUSD Tests Key 0.75 Level
The AUDUSD is consolidating in today’s Asia morning, tiring as it bumps against the psychologically key 0.75 whole figure level. Significantly, with the massive rally since the January low near the psychologically key 0.70 whole figure level, the AUDUSD has broken above downchannel resistance (on the weekly chart)…
AUDUSD Weekly Hammer Nearing Weekly Chart Downchannel Resistance
The AUDUSD is edging higher going into today’s European morning, breaking upchannel resistance (on the 4hr chart). Significantly, last week’s brief surge above downchannel resistance (on the weekly chart) strengthens the uptrend since February…
USDCAD Breaking Daily Chart Triangle Resistance
Register/Login to freely access technical analysis on the market described in the headline above. Today’s Top 3 Trades includes technical analysis on: FX (AUDUSD | Silver) + Today’s Top Trade (AUDUSD) Join the world’s largest asset manager and 2 of the world’s 5 largest (and 5 of the 10 largest) hedge funds by AUM asRead More
Natural Gas (NG) Weekly Gravestone Retests Key 4.5 Level
Natural Gas (NG) is firming after yesterday’s healthy profittaking, trying to bounce off uptrend support (on the 4hr chart) and the psychologically key 4.5 whole figure level. Significantly, NG is forming a weekly Gravestone, and somewhat of a triangle (on the weekly chart) suggesting a moderately low likelihood of NG sliding back towards triangle support in the next week or so…
Gold (GC) Bouncing Off Weekly Chart Triangle Support
Gold (GC) appears ready for consolidation in the next day or so after the strong bounce this past week off the psychologically key 1800 whole figure level. Significantly, GC has rebounded off triangle support (on the weekly chart), with a decent likelihood of completing this triangle by month end…