VIX (VX) Sharply Higher as Santa Claus Rally Unwinding

Euro Weekly Chart

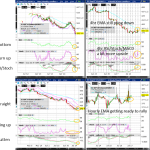
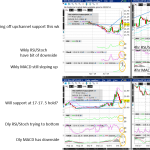
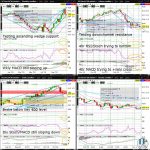
…75, with the RSI and stochastics turning down, consolidating recent gains. VIX (CFE VX Dec14) Weekly/Daily/4hr/Hourly VX powered ahead yesterday, leaving no doubt that traders have become overly complacent in pricing volatility in recent weeks. The VX has hit some resistance in the 17.5 zone, and will probably need a day or so of consolidation before it is ready to challenge the downchannel resistance line seen in the daily chart. Weekly and daily…

Corn (ZC)/Wheat (ZW)/Coffee (KC)/VIX Rally Off Bottom; S&P500 (ES)/Nasdaq100 (NQ) Finally Drop; Natural Gas (NG) OS

ZC (Wkly/Dly/4hr/Hrly/30min/5min) Charts

…after yesterday’s strong selloff, NG can be seen gearing up for a tradable bottom. ZC Weekly/Daily/4hr/Hourly/30min/5min ZW Weekly/Daily/4hr/Hourly/30min/5min KC Weekly/Daily/4hr/Hourly/30min/5min VIX Weekly/Daily/4hr/Hourly/30min/5min ES Weekly/Daily/4hr/Hourly/30min/5min NQ Weekly/Daily/4hr/Hourly/30min/5min NG Weekly/Daily/4hr/Hourly/30min/5min Newsletter Guide…

EURUSD, GBPUSD, VIX (VX) Refueling

Euro Weekly Chart

…hastics, and 4hr MACD, which are consolidating following the recent rally. VIX (CFE VX Jan15) Weekly/Daily/4hr/Hourly As of today, the January expiry will replace the December contract in my analysis as the roll begins. Friday saw another surge in the VX, leaving it just below the downchannel resistance at 20 (seen in the daily chart) and the horizontal resistance line around 19.5 (seen on the weekly chart). The weekly chart also suggests a target…

Nasdaq100 (NQ) Near 50% Fib Retrace of Aug Slide

NQ (Nasdaq100) Technical Analysis

…nalysis on one market from the most recent edition of Indices (Nasdaq100 | VIX) + Today’s Top Trade (VIX) Join the world’s largest asset manager and 2 of the world’s 5 largest hedge funds by AUM as daily readers of Tradable Patterns’ technical analysis. Since becoming available on Bloomberg, Refinitiv and FACTSET, readers have included every single one of the global top 10 investment banks. If you represent an institutional investor or potential d…

S&P500 (ES), Nasdaq100 (NQ) Back to Breakdown Range

VIX (Wkly/Dly/4hr/Hrly) Charts

…(as seen in the daily chart). Adding to the cautiously bullish case of the VIX near-term, on the weekly chart, the VIX can argubaly have bounced yesterday off of an upchannel support line. Despite the sharp fall in the VIX over the last week and its drag on the weekly RSI and Stochastics, the weekly MACD green line is still sloping up. Also of note, the daily RSI and Stochastics are trying to bottom, although the daily MACD still suggests a bit mo…

Soybean (ZS) Weekly Chart Ascending Wedge Completes

ZC (Corn) Technical Analysis

…ncludes technical analysis on: Agris (Soybean | Corn) + Today’s Top Trade (VIX) Join the world’s largest asset manager and 2 of the world’s 5 largest (and 5 of the 10 largest) hedge funds by AUM as daily readers of Tradable Patterns’ technical analysis. As seen on Bloomberg, Refinitiv, FACTSET and Interactive Brokers, readers regularly include global top 10 investment banks. If you represent an institutional investor or potential distribution part…

Silver (SI) Testing 61.8% Fib Retrace of Feb-Mar Crash

SI (Silver) Technical Analysis

…cal analysis on: Metals/Energy (Silver | Natural Gas) + Today’s Top Trade (VIX) Join the world’s largest asset manager and 2 of the world’s 5 largest (and 4 of the 10 largest) hedge funds by AUM as daily readers of Tradable Patterns’ technical analysis. Since becoming available on Bloomberg, Refinitiv and FACTSET, readers have included every single one of the global top 10 investment banks. If you represent an institutional investor or potential d…

Cotton (CT) Weekly MACD Positively Crossing

CC (Cocoa) Technical Analysis

Please Register/Login to view Today’s Top 3 Trades. Each day, the top 3 setups and/or momentum trade ideas (from the Watchlist) is presented. All markets analysed are ordered by how favourable the risk:reward presented by the trade idea appears, with the market listed at the top deemed at the time the screenshots are captured to be the highest conviction trade for the day. As many of the trade setups and momentum plays are ongoing ideas inspiring…

S&P500 (ES) Edging Above Weekly Chart Ascending Wedge Resistance

VX (VIX) Technical Analysisoa-technical-analysis

…ve. Today’s Top 3 Trades includes technical analysis on: Indices (S&P500 | VIX) + Today’s Top Trade (Silver) Join the world’s largest asset manager and 2 of the world’s 5 largest (and 5 of the 10 largest) hedge funds by AUM as daily readers of Tradable Patterns’ technical analysis. As seen on Bloomberg, Refinitiv, FACTSET and Interactive Brokers, readers regularly include global top 10 investment banks. If you represent an institutional investor o…

Backtested Performance

…Long 456.50 447 -9.50 -475 -2577.12 430.50 -26 -1300 -11797.28 Mar 8, 2017 VIX (CFE VX Mar17) – Long 12.70 12.70 0 0 -2577.12 12.18 -0.52 -520 -12317.28 Mar 9, 2017 VIX (CFE VX Mar17) – Long 12.70 12.15 -0.55 -550 -3127.12 11.98 -0.72 -720 -13037.28 Date Market AnalysedMarket Symbol – BiasClosing Price on Day Market Analysed (quotes from Interactive Brokers’ desktop software TWS; refer to http://marketwatch.com, http://esignal.com, http://fxstreet…