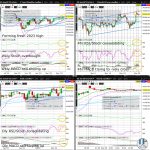
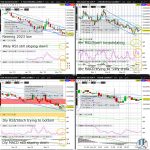
S&P500 (ES) Edges To New 2023 High

The S&P500 (ES) is consolidating after edging higher yesterday to a fresh 2023 high above triangle resistance (on the weekly chart). ES increasingly appears ready to join the Nasdaq100 (NQ) in gravitating to the 61.8% Fib retrace of the slide from the January 2022 high to October 2022 low (as can be seen more easily on a weekly chart on tradingview.com)…

Corn (ZC) Bounce Off 2023 Low @ Fresh May High

Corn (ZC) gained for a 5th straight day Friday going into the US Memorial Day long weekend holiday, closing just shy of Friday’s fresh May high. The sharp reversal from the 2023 low formed 2 weeks ago at just below the 2022 low (formed in July) and the 50% Fib retrace of April 2020 to April 2022 bull market (as can be seen more easily on a monthly chart on tradingview.com), suggests more upside in June…

VIX (VX) Bounce Off 2023 Low Testing Key 20 Level

The VIX (VX) is consolidating for a second straight day Wednesday’s surge, appearing poised to continue next week efforts at a major bottom with the green weekly Tombstone trying to bounce off the 2023 low. Any break today above downchannel resistance (on the 4hr chart) and descending wedge resistance (on the daily chart) will dramatically increase odds next week of a break of the weekly chart descending wedge resistance….

USDCHF Breaks Weekly Chart Descending Wedge Resistance

The USDCHF is consolidating after surging from Monday’s low, hesitating at triangle resistance (on the daily chart) and digesting this week’s break above descending wedge resistance (on the weekly chart). With the USDCHF comfortably above the psychologically key 0.90 whole figure level, odds are decent for renewed momentum next week in the bounce off the 2023 low and the weekly chart descending wedge support…

Soybean (ZS) Tests 2022 Low

Soybean (ZS) is trying to firm to start the week, but remains vulnerable this week to extending the slide from the 2023 high to a fresh 2023 low. Although ZS is increasingly likely to see some short covering as it probes its 2022 low and tests downchannel support (on the 4hr chart), odds are elevated for a deeper slide by Q3 sometime to the 2021 low (formed that November) near the 61.8% Fib retrace of the May 2019 to June 2022 bull market (as can be seen more easily on a monthly chart on tradingview.com)…