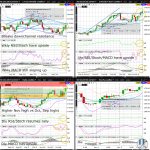
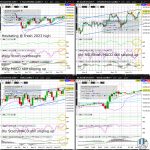
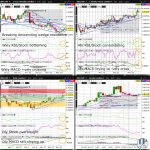
Raw sugar (SB) gained more than 0.5% yesterday, closing at a fresh 2023 high. SB is now resuming the bull market since May 2020. The earliest SB will test its record high (formed Feb 2011 as seen easier on a monthly chart on tradingview.com) though will be in 2024…
Category: Today’s Top 3 Trades
Coffee Daily Nov 6, 2023
Arabica Coffee (KC) surged more than 3% Friday, closing above the October and September highs. KC is resuming its rebound off just above the 2023 low, and poised to test a redrawn downchannel resistance (on the weekly chart) this week….
Sugar Daily Sep 7, 2023
Raw sugar (SB) reversed more than 1.5% yesterday after breaking to a fresh 2023 high Tuesday. Regardless, with SB still comfortably above the psychologically key 25 whole figure level, SB’s bull market from April 2020 to April 2023 is likely to continue extending by mid month…
Cocoa Daily Aug 7, 2023
New York Cocoa (CC) edged higher Friday, closing just above upchannel support (on the daily chart). Nevertheless, with last week’s weekly Doji rejected at upchannel resistance (on the weekly chart) near the 2023 high, odds are elevated for more orderly consolidation this week with initial support around the 2015 high (formed that December as can be seen easier on a monthly chart on tradingview.com)…
Cocoa Daily Jul 25, 2023
New York Cocoa (CC) edged higher with its daily Doji yesterday, and is now just shy of last week’s 2023 high above the 2015 high (formed that December as can be seen easier on a monthly chart on tradingview.com). CC is trying to extend towards upchannel resistance (on the weekly chart), continuing the massive bull market rally that began November 2022…
WTI Crude (CL) Retesting Weekly Chart Prior Downchannel Resistance
WTI Crude (CL) is edging higher going into today’s 1030am EST highly anticipated weekly inventory and Thursday’s US unemployment claims. With CL bouncing yesterday off the psychologically key 70 whole figure level, odds are decent for a weekly close above downchannel resistance (on the weekly chart)…
VIX (VX) Testing Weekly Chart Descending Wedge Support
Register/Login to freely access technical analysis on the market described in the headline above. Today’s Top 3 Trades includes technical analysis on: Indices (VIX | S&P500) + Today’s Top Trade (Gold) Join the world’s largest asset manager and 3 of the world’s 5 largest (and 5 of the 10 largest) hedge funds by AUM asRead More
Soybean (ZS) Testing Weekly Chart Descending Wedge Resistance
Soybean (ZS) is trying to gain for a 3rd straight day after a sharp reversal off a fresh 2023 low (just below the 2022 low), but is likely to see a bit of healthy consolidation in the next day or so. Any break above downchannel resistance (on the 4hr and daily chart) will likely have to wait until at least late week, and would dramatically reduce the odds of a test by Q3 sometime of the 2021 low (formed that November) near the 61.8% Fib retrace of the May 2019 to June 2022 bull market (as can be seen more easily on a monthly chart on tradingview.com)….
S&P500 (ES) Testing 2023 High Ahead of NFP
The S&P500 (ES) is edging higher just shy of Monday’s fresh 2023 high and triangle resistance (on the weekly chart). Any selloff following today’s highly anticipated US Non-Farm Payrolls (NFP) at 830am EST will dramatically increase odds of a break going into next week below upchannel support (on the 4hr chart)…
USDCHF Weekly MACD Positively Crossing
The USDCHF is consolidating just below the April high after last week’s decisive breakout above descending wedge resistance (on the weekly chart). Nevertheless, the bounce off the 2023 low and the weekly chart descending wedge support to well above the psychologically key 0.90 whole figure level appears to have formed a major bottom (as can be seen easier on a monthly chart on tradingview.com)…